VMwareAria.github.io
Create Dashboard
Dashboards present a visual overview of the performance and state of objects in your virtual infrastructure. You use dashboards to determine the nature and timeframe of existing and potential issues with your environment. You create dashboards by adding widgets to a dashboard and configuring them.
As a part of this lab we are going to build custom dashboard which will allow us to see performance data for selected application, this will simplify troubleshooting.
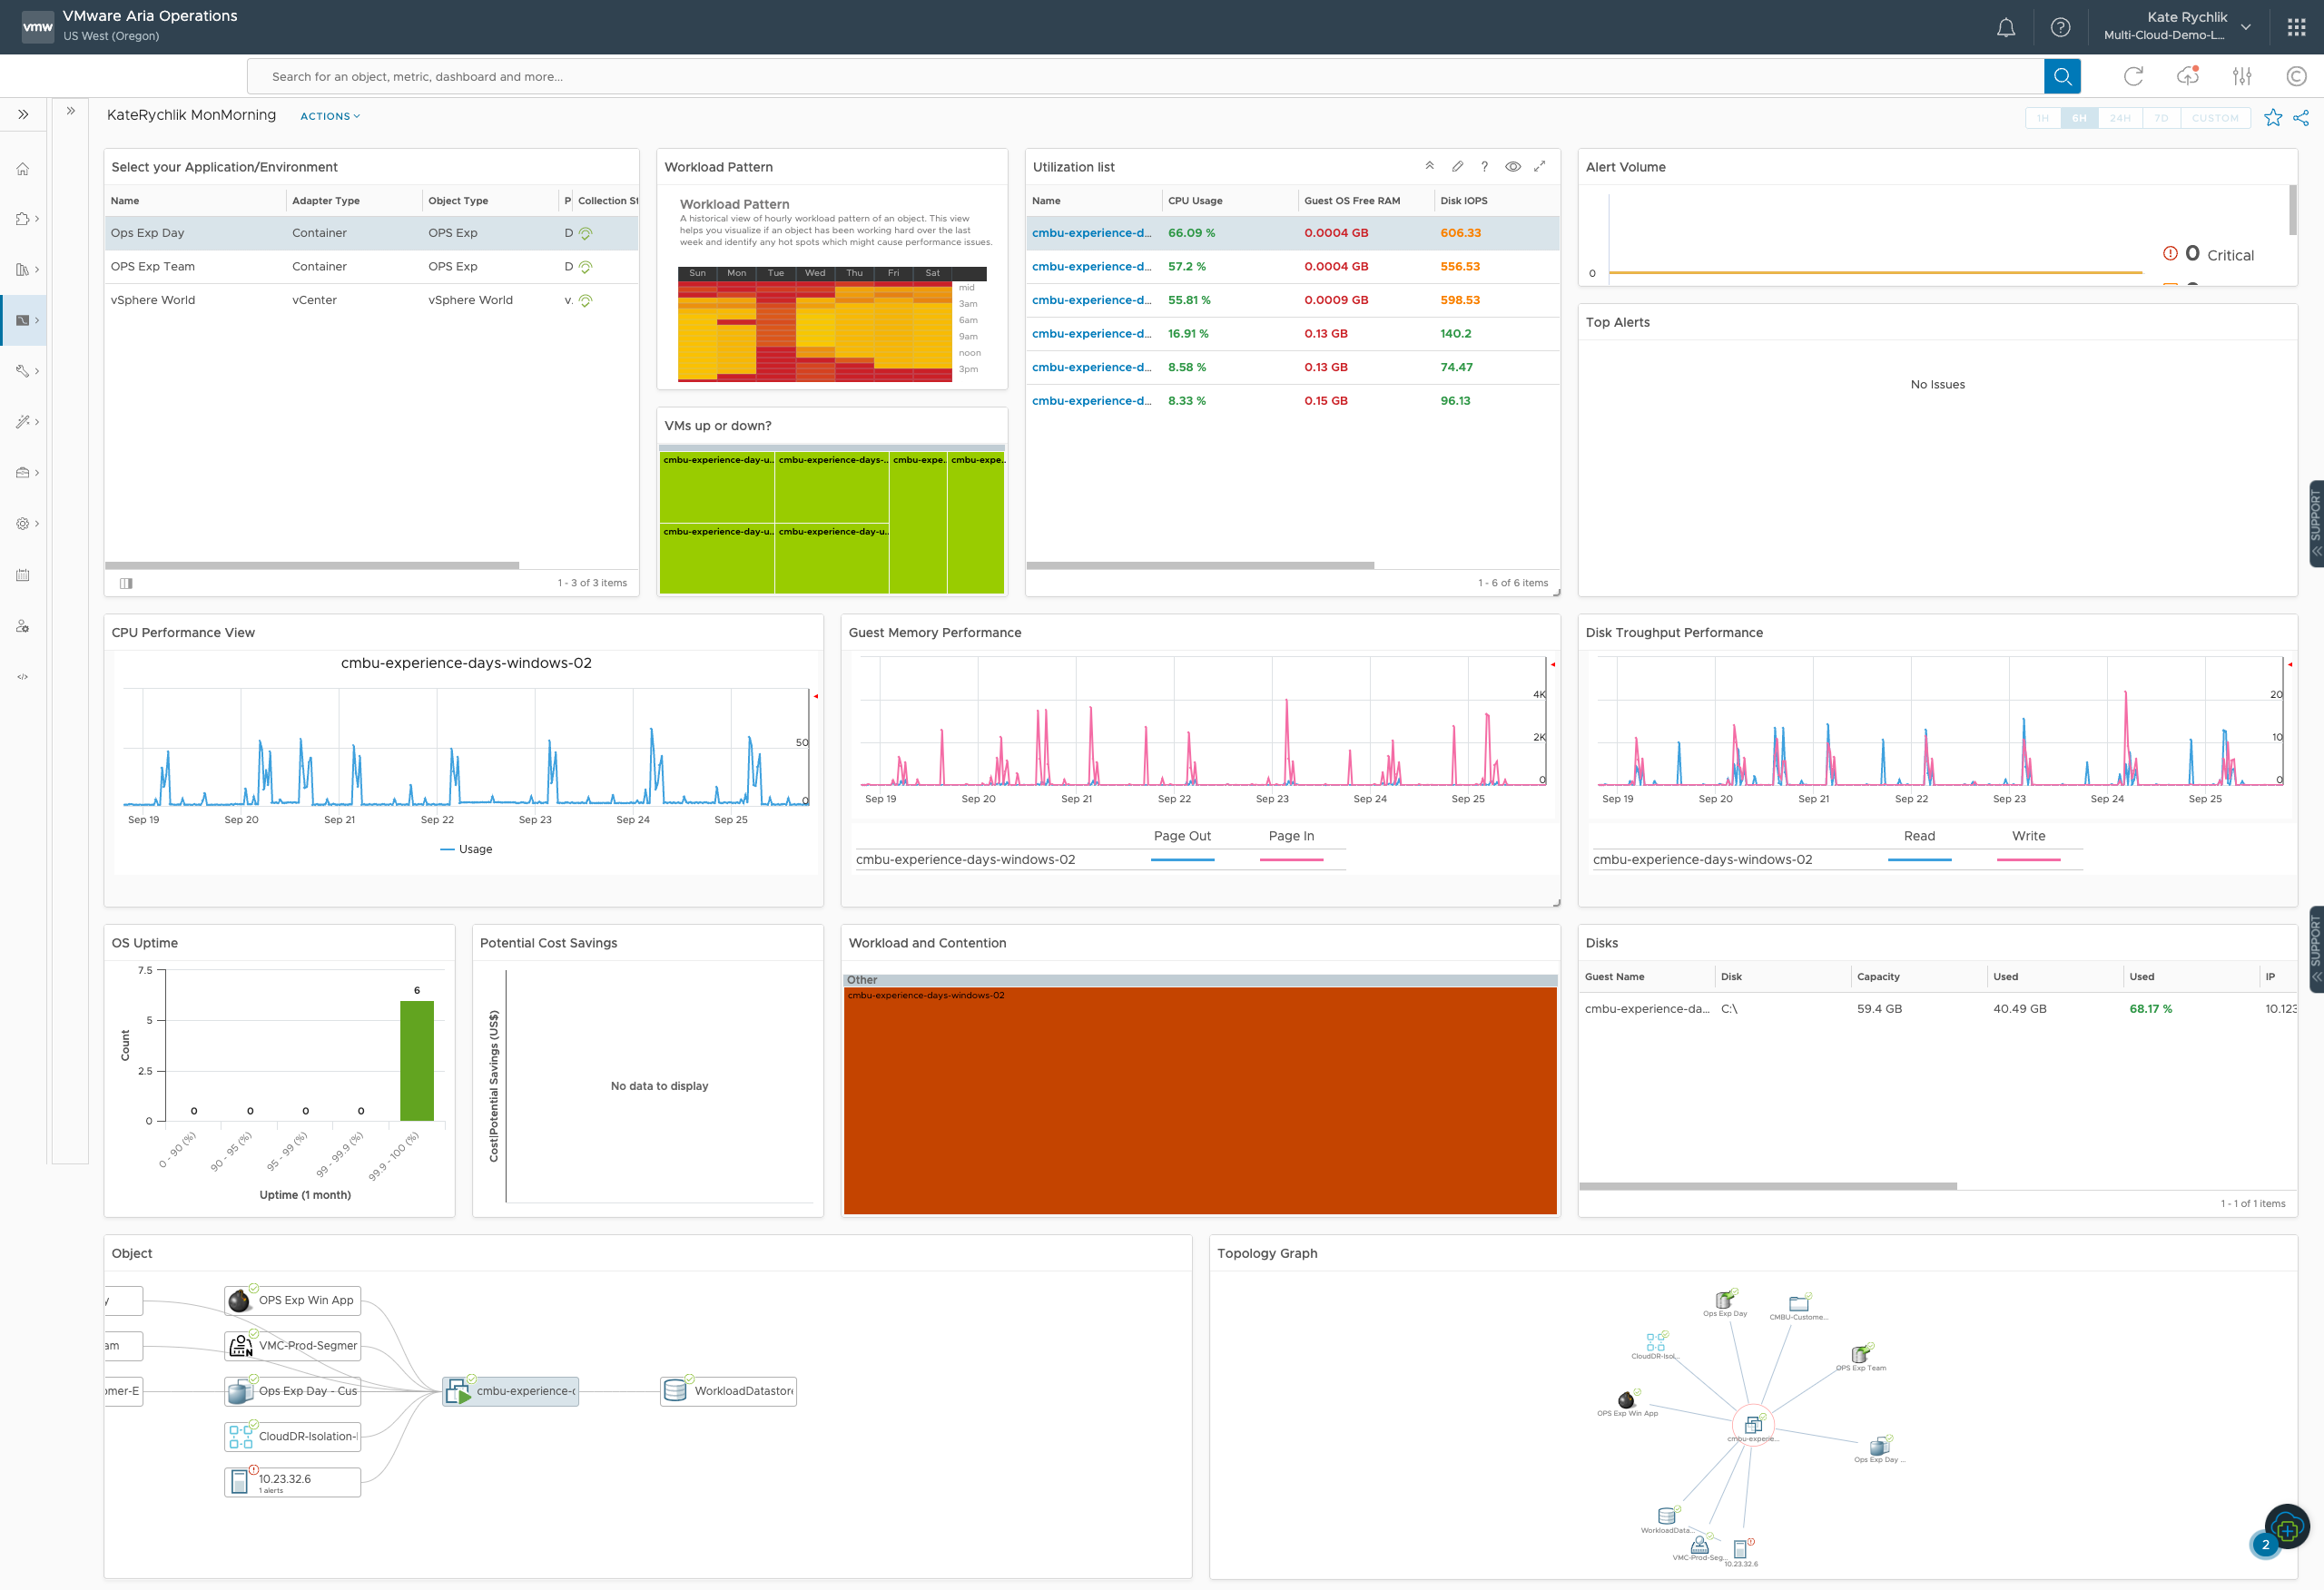
The goal is to create a dashboard that will look like this:
Lets start!
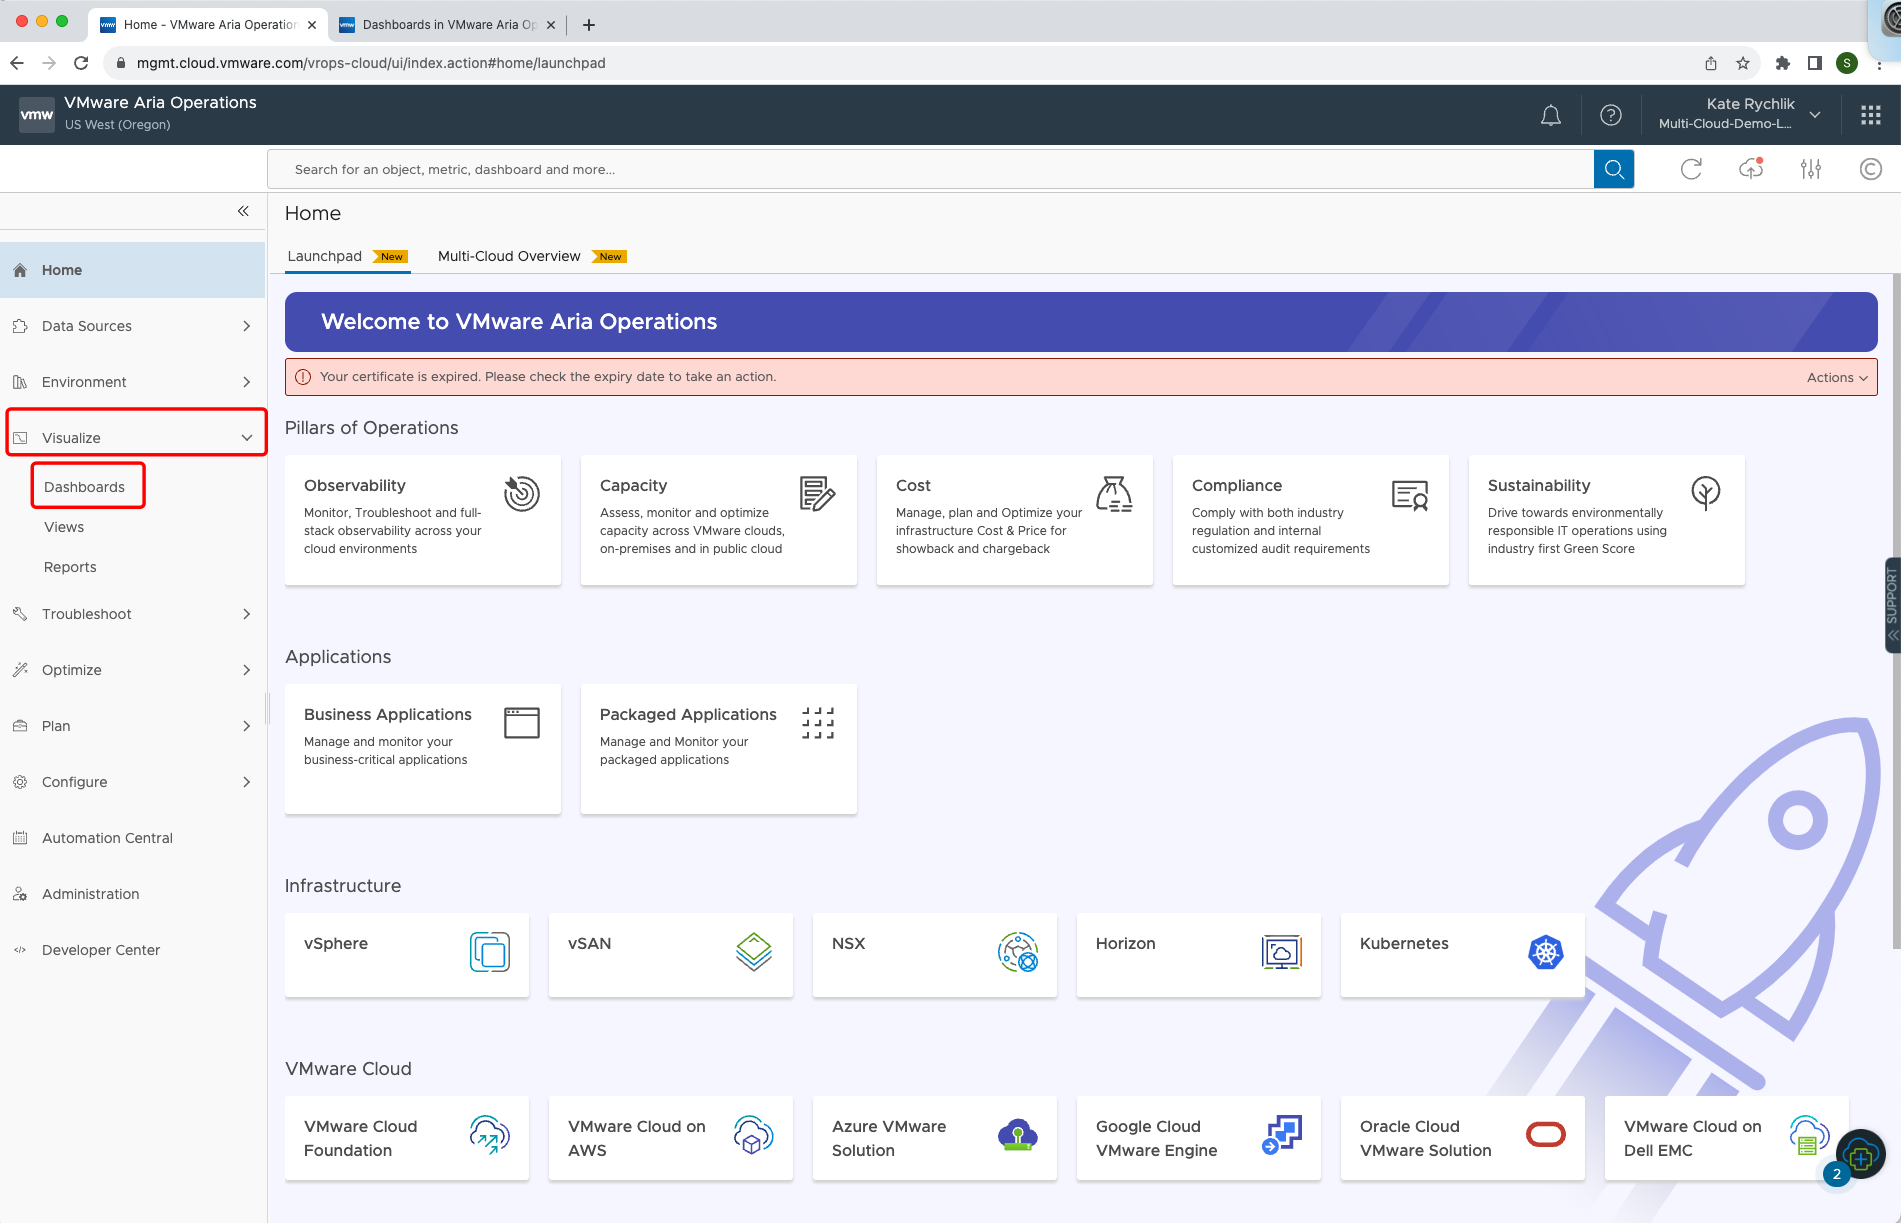
In Visualize section select Dashboards.
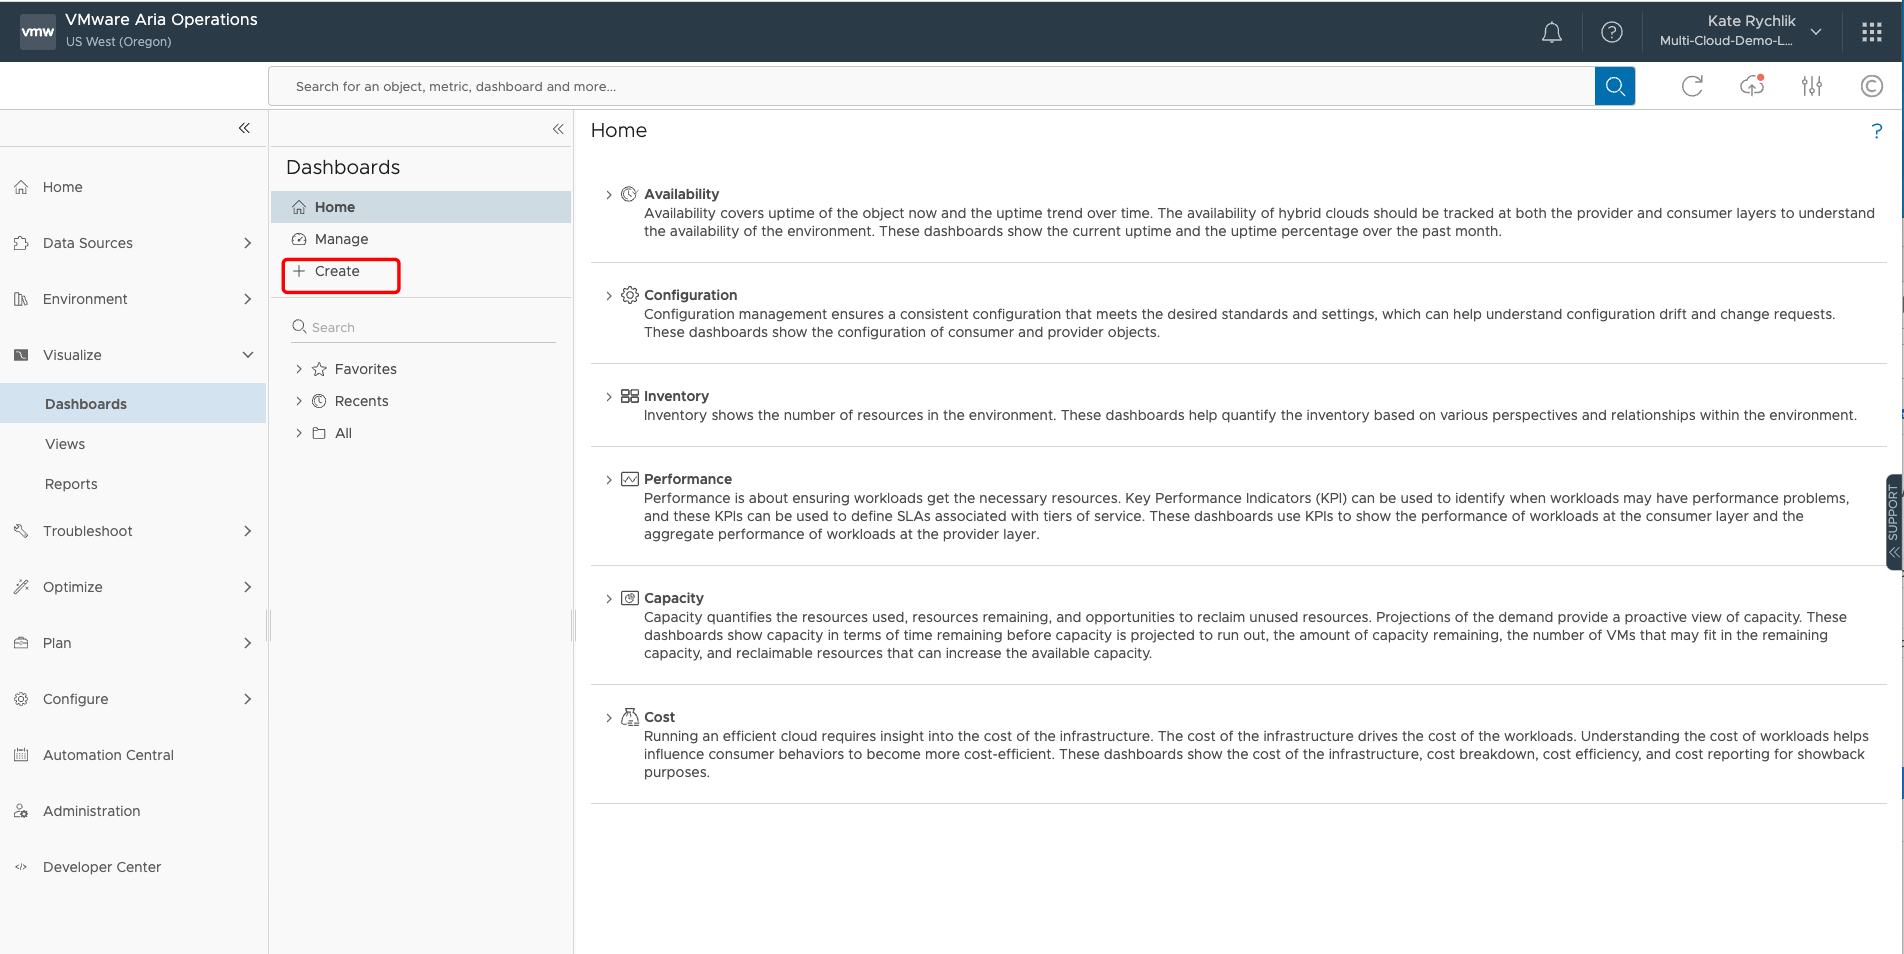
Click on + Create to start building dashboard.
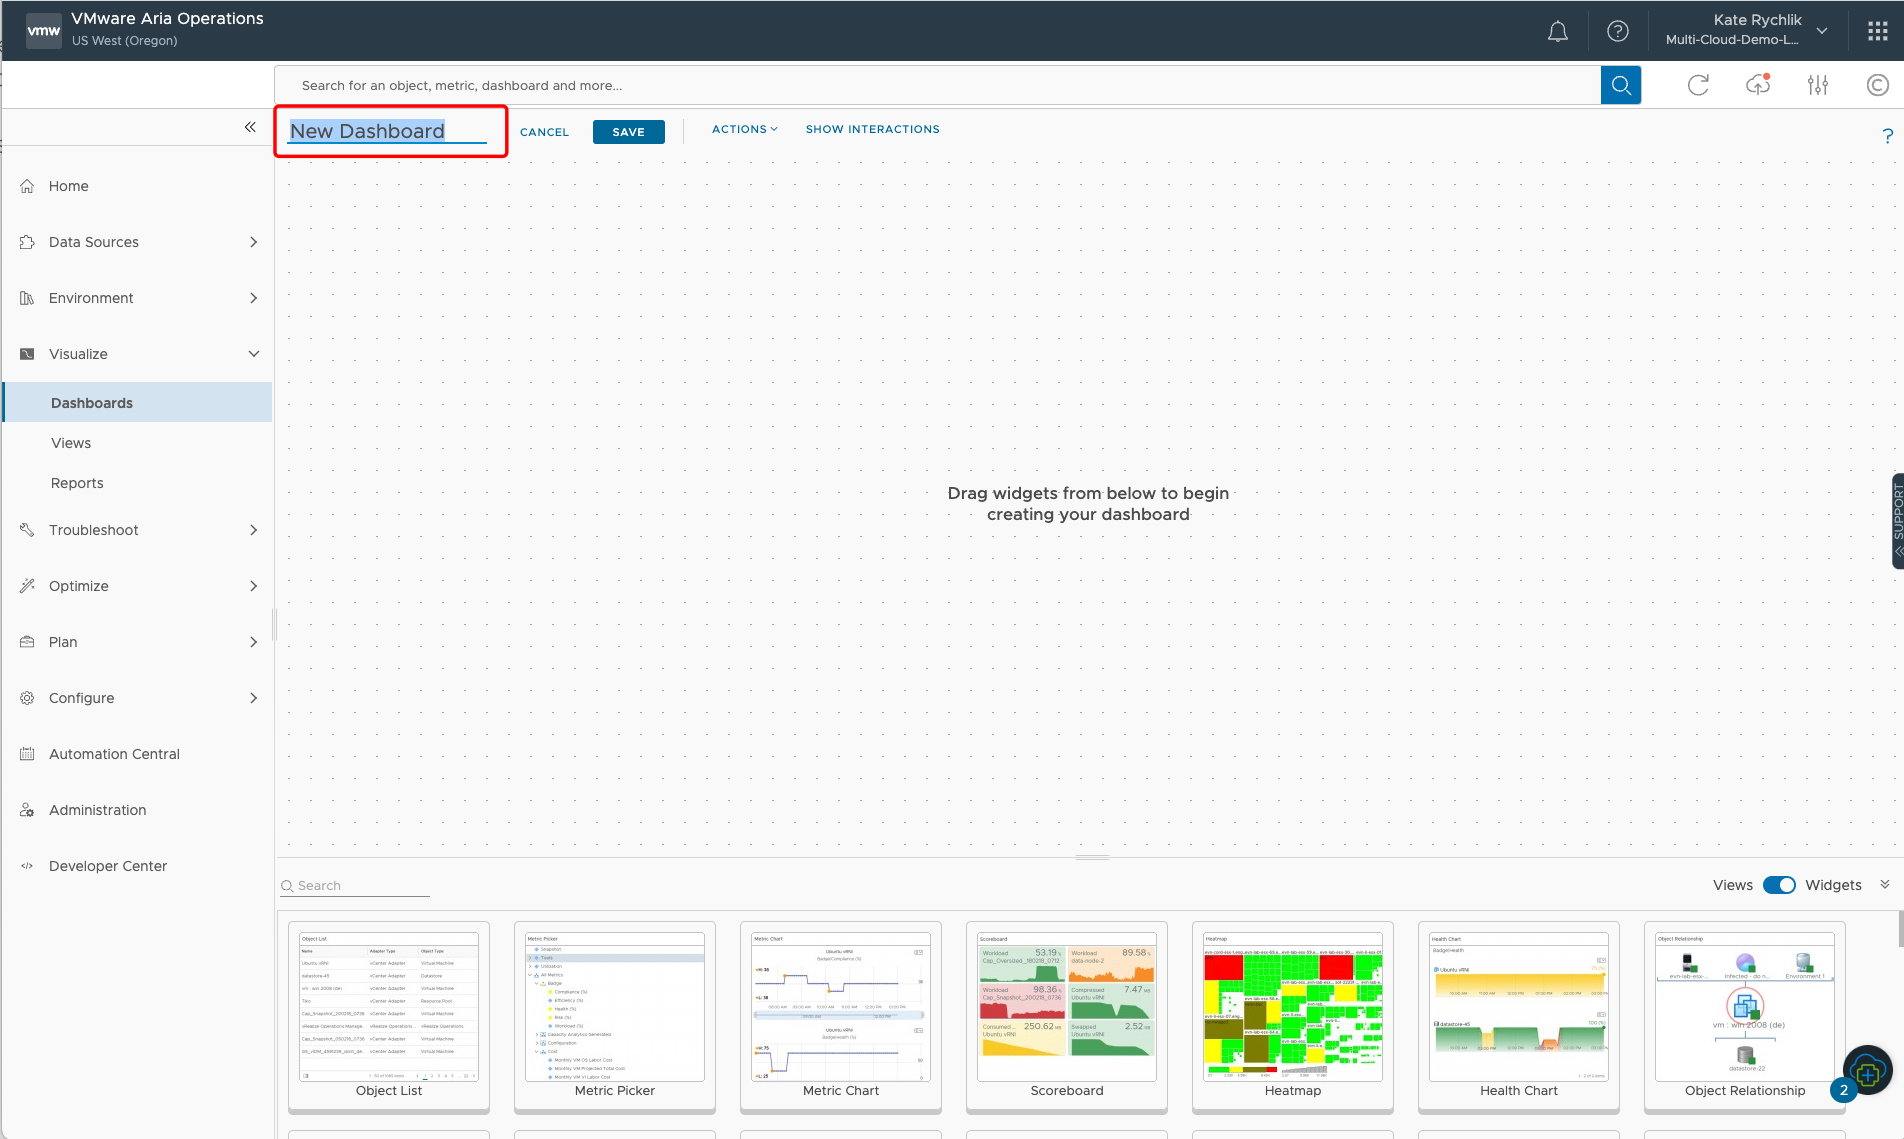
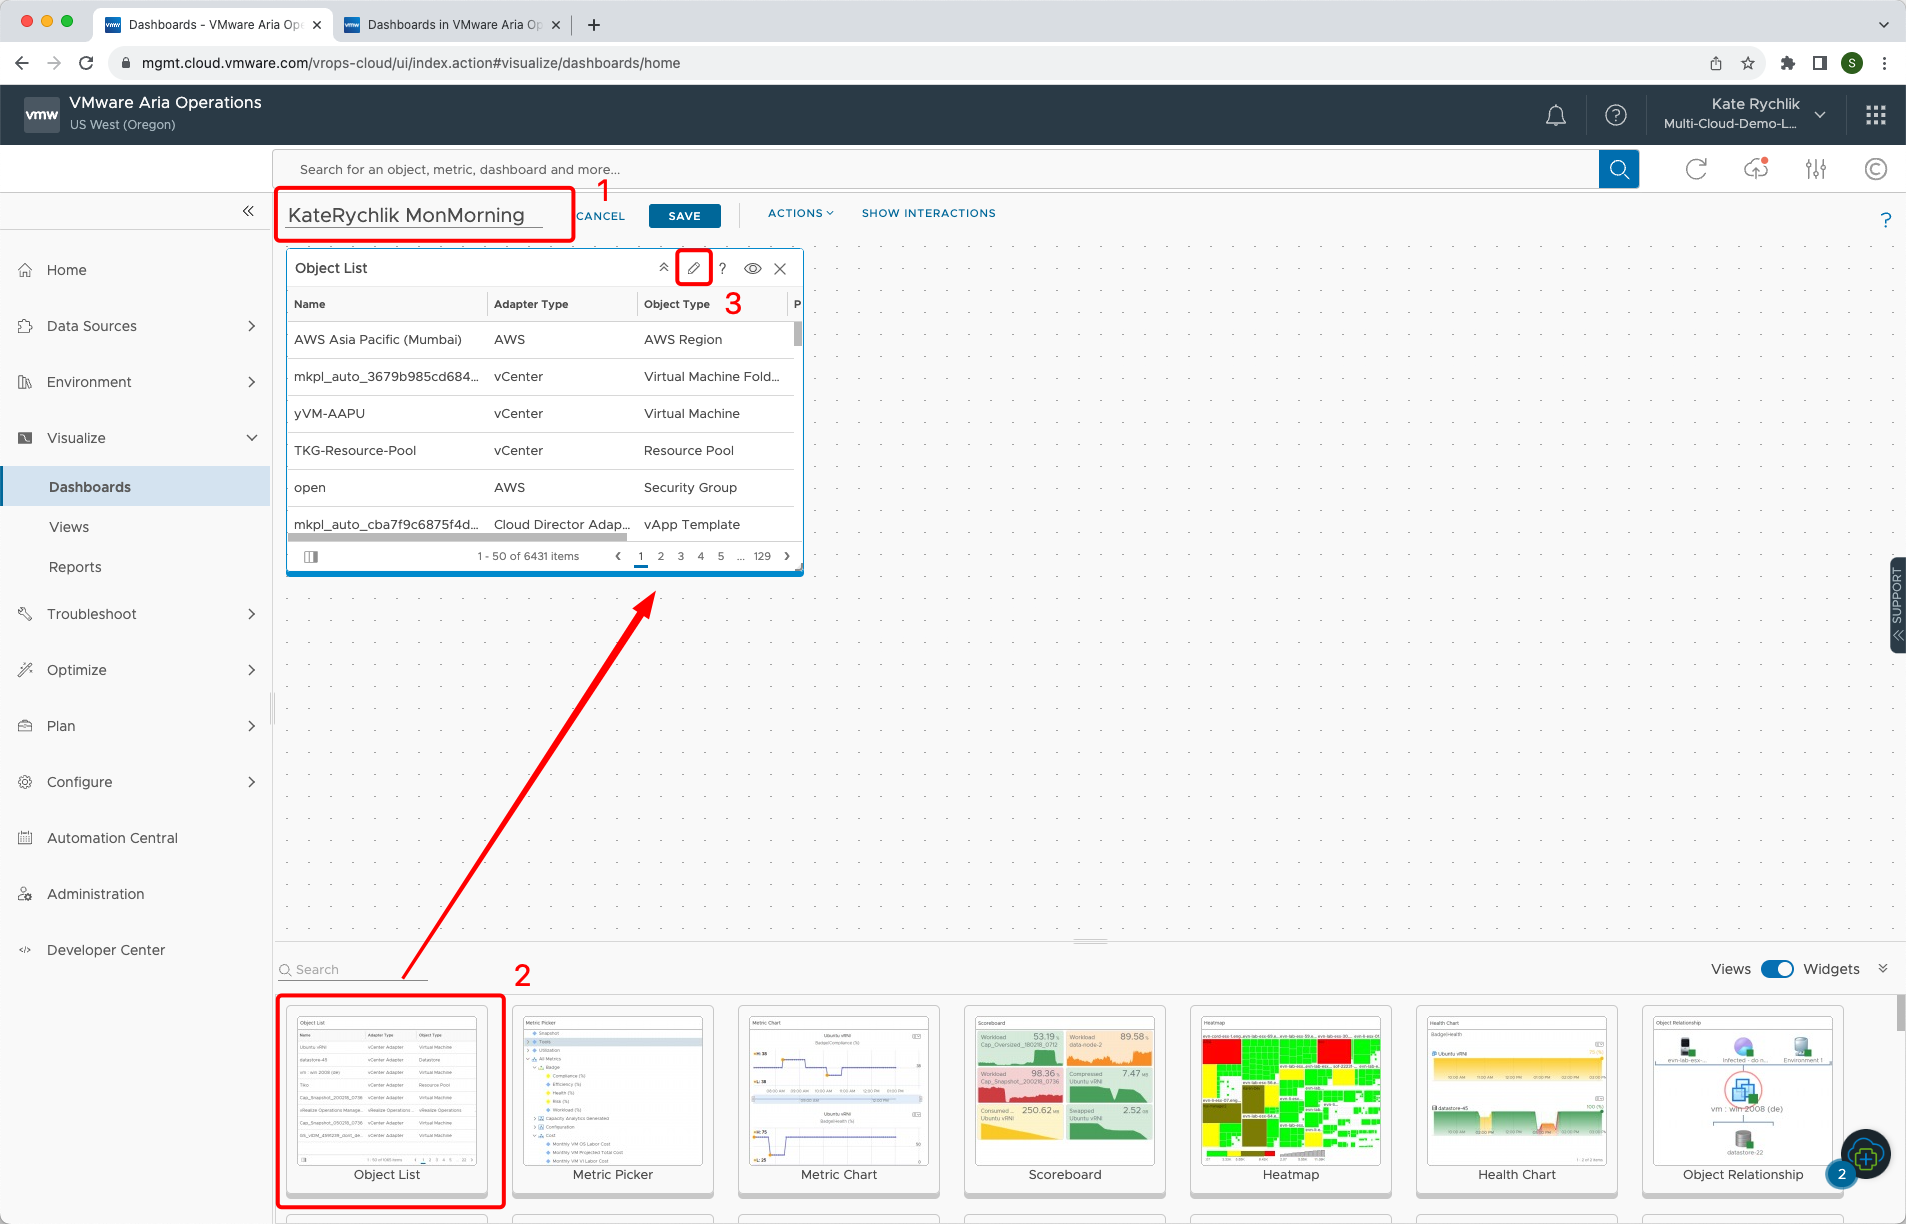
New blank dashboard canvas opens. Provide dashboard name by replacing New Dashboard name with your FirstNameLastName MonMorning .
Note: This is very important step to name your dashboard properly. The lab is hosted on one VMware Aria Operations instance and having multiple dashboards with the same name can cause issues!
Create Application Selection Filter
- Confirm that you renamed the dashboard to your “FirstNameLastName Mon Morning” as per exaple.
- Select Object List widget and drop it down to canvas.
- Click on pencil icon to edit.
-
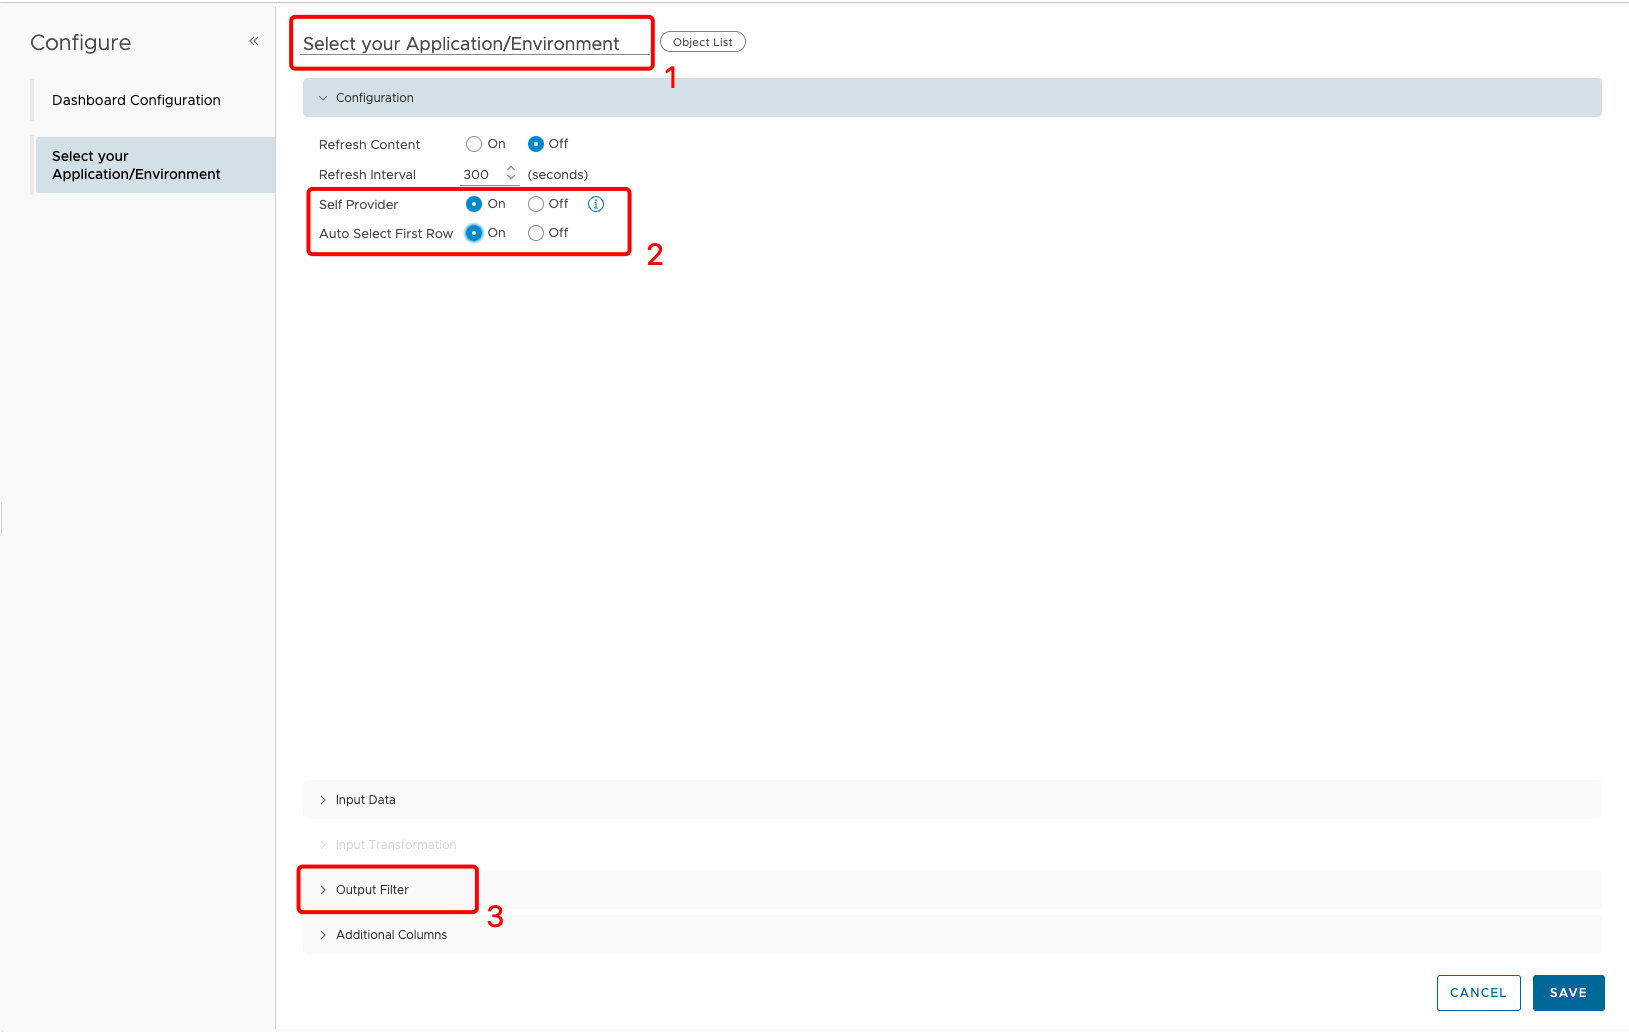
Provide List Object name “Select your Application/Environment”.
-
Change Self Provider and Auto Select First Row to On.
-
Clik on > Output Filter.
-
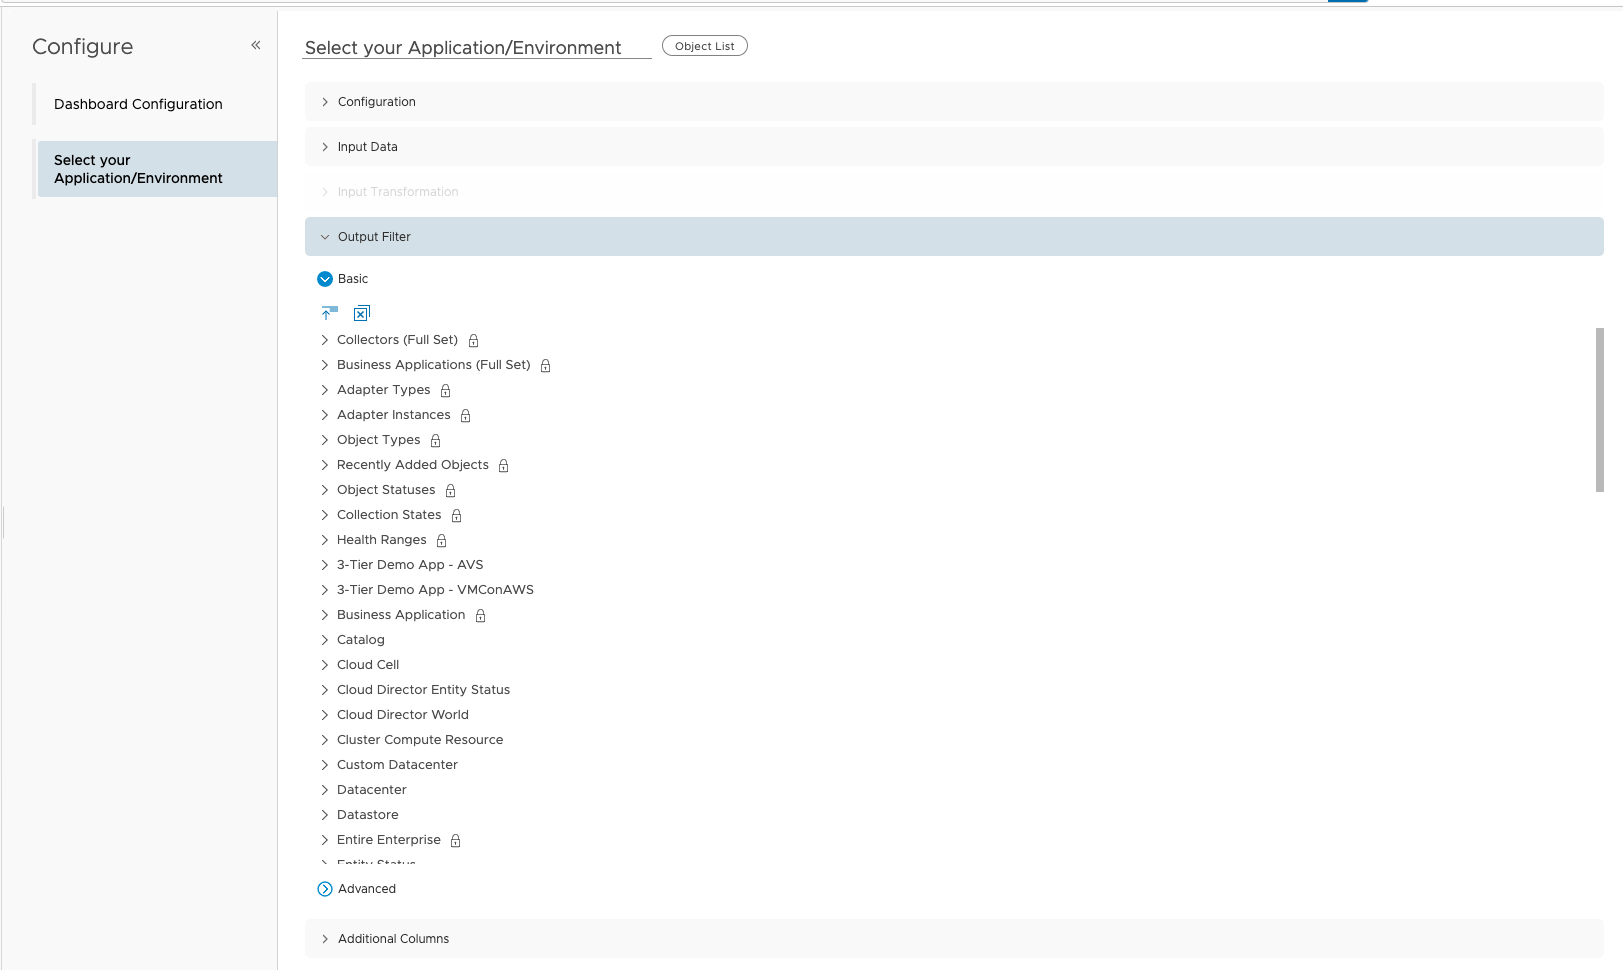
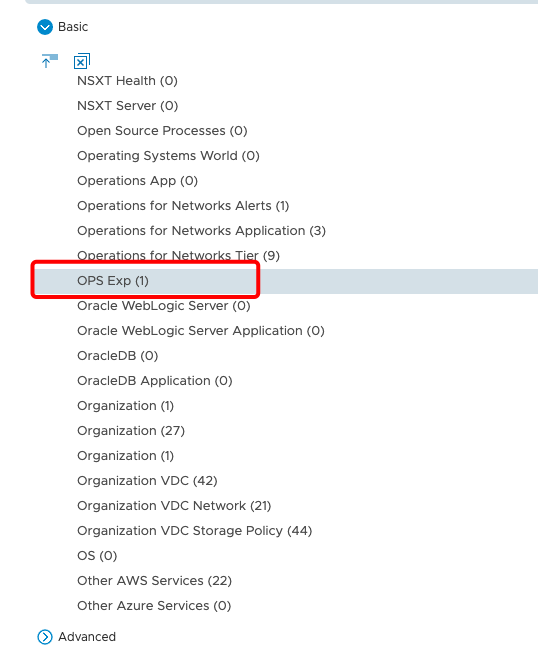
In >Output Filter scroll down the list and make multiple selections:
-
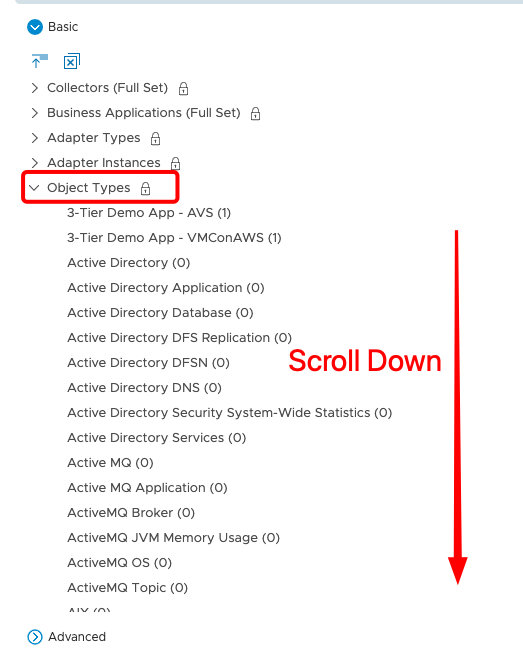
Collaps Object Types and scroll down to find OPS Exp object. Click on it to mark it down.
-
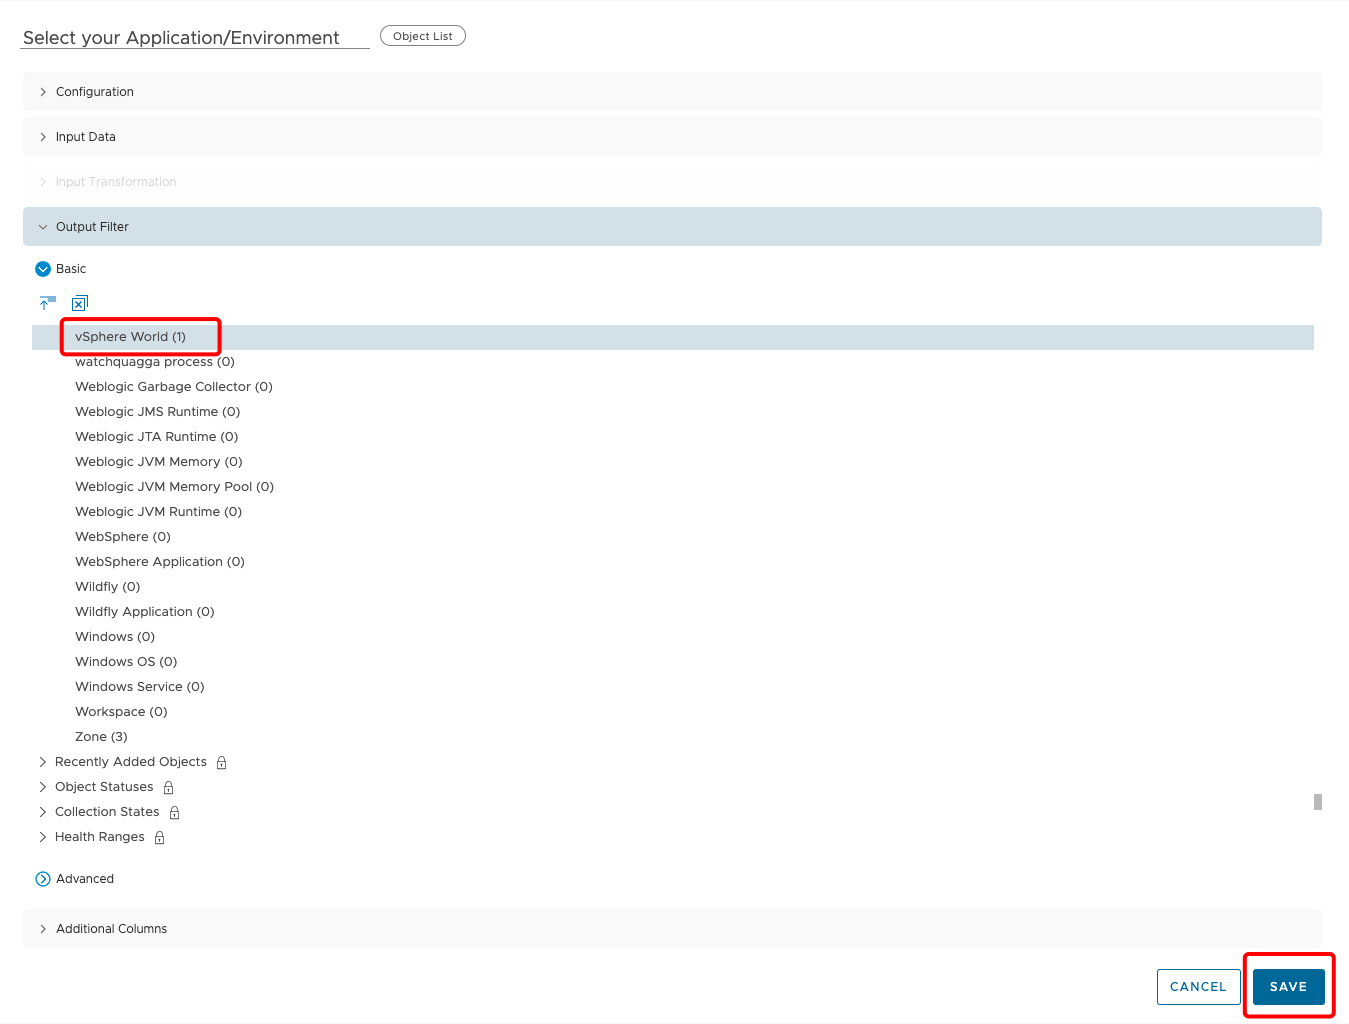
Scroll down in the same group and select vSphere World.
-
Click SAVE.
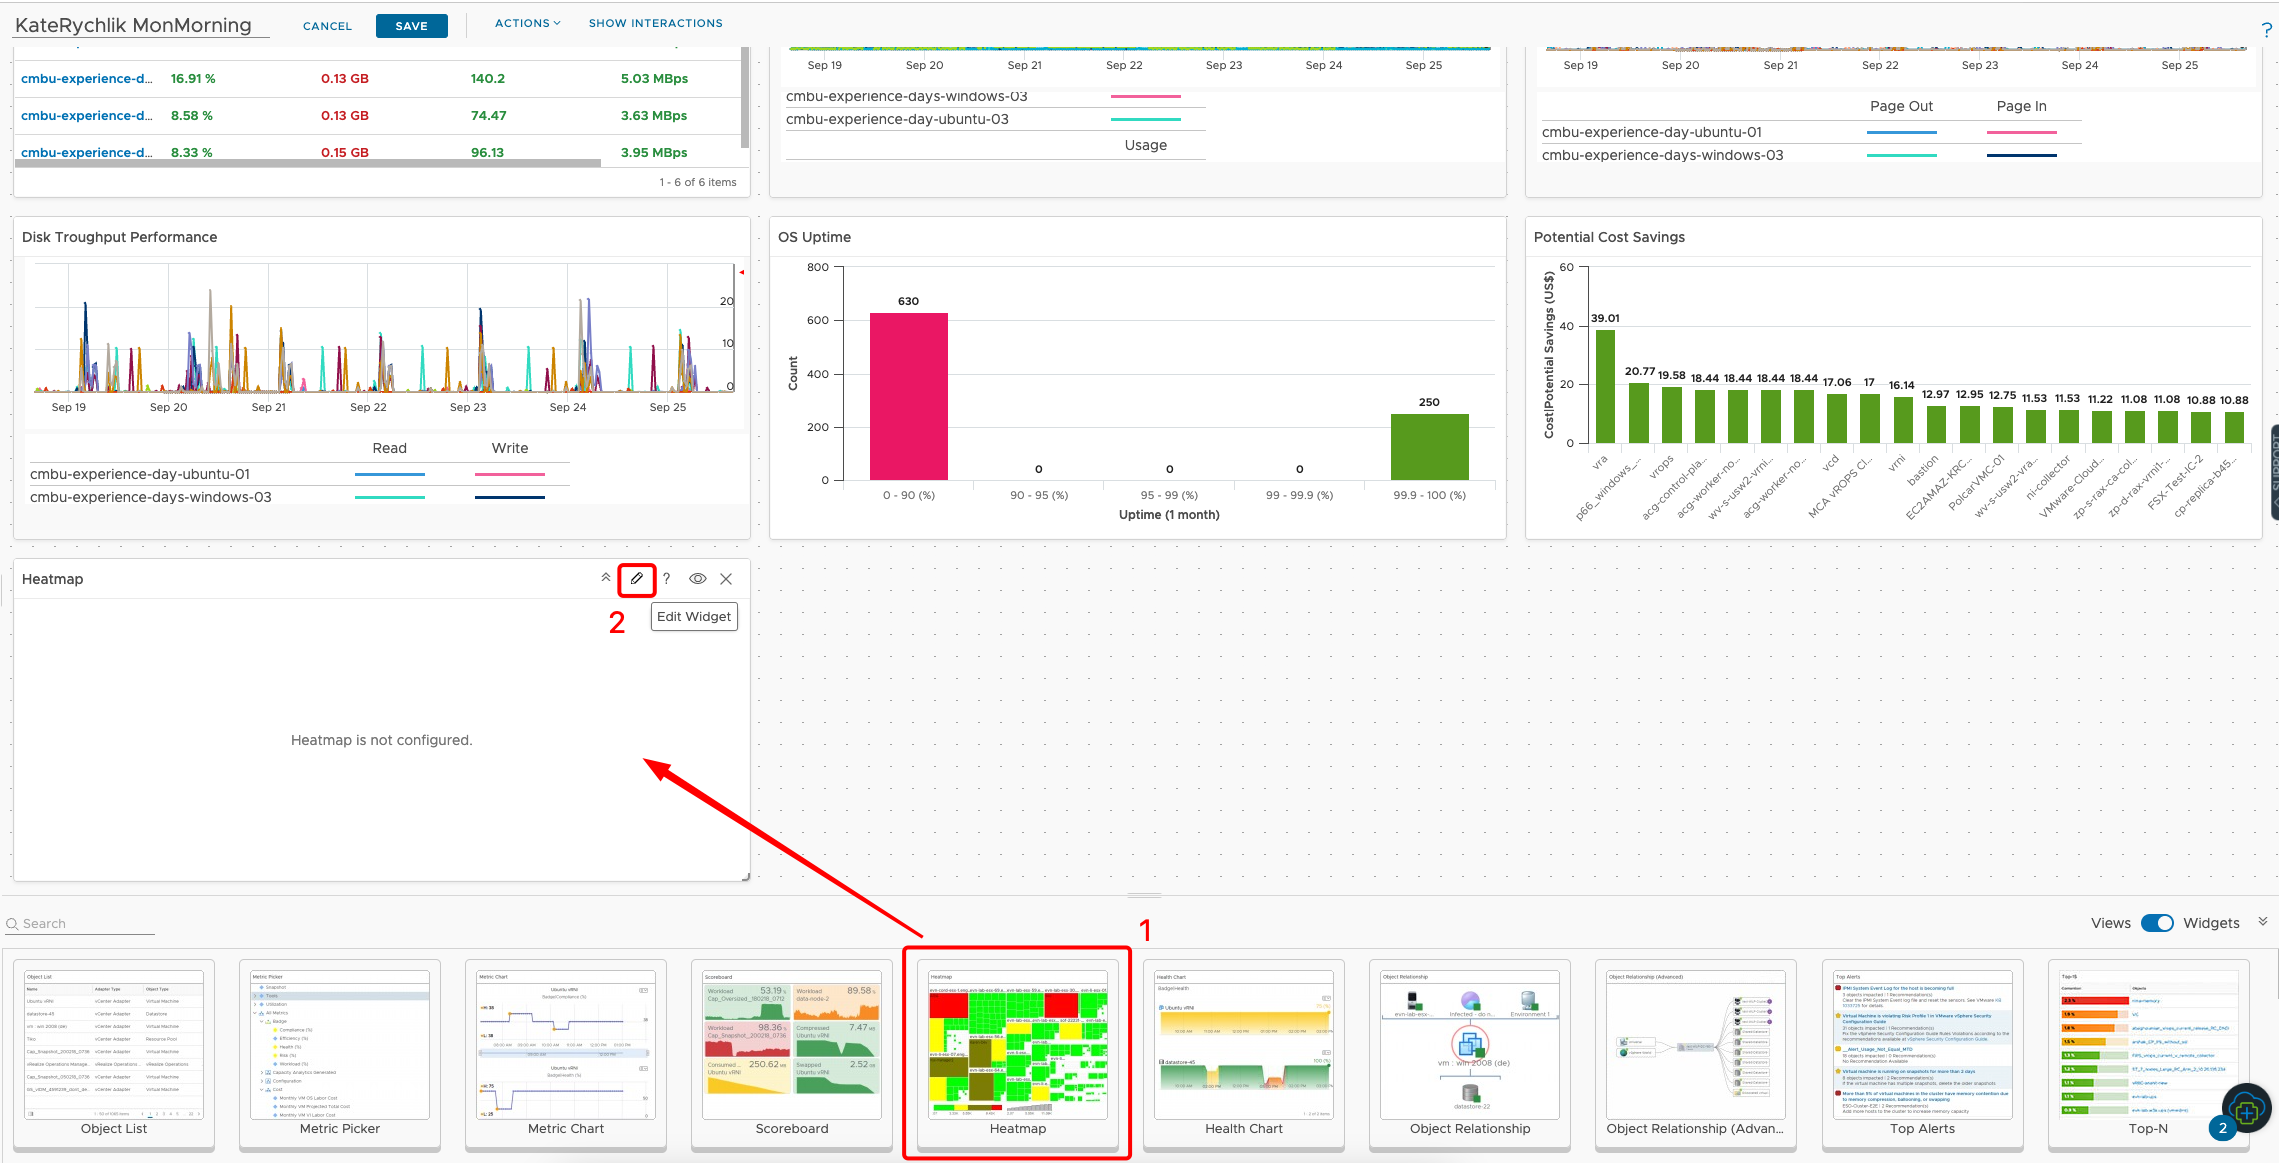
Create VMs Up or Down heatmap
-
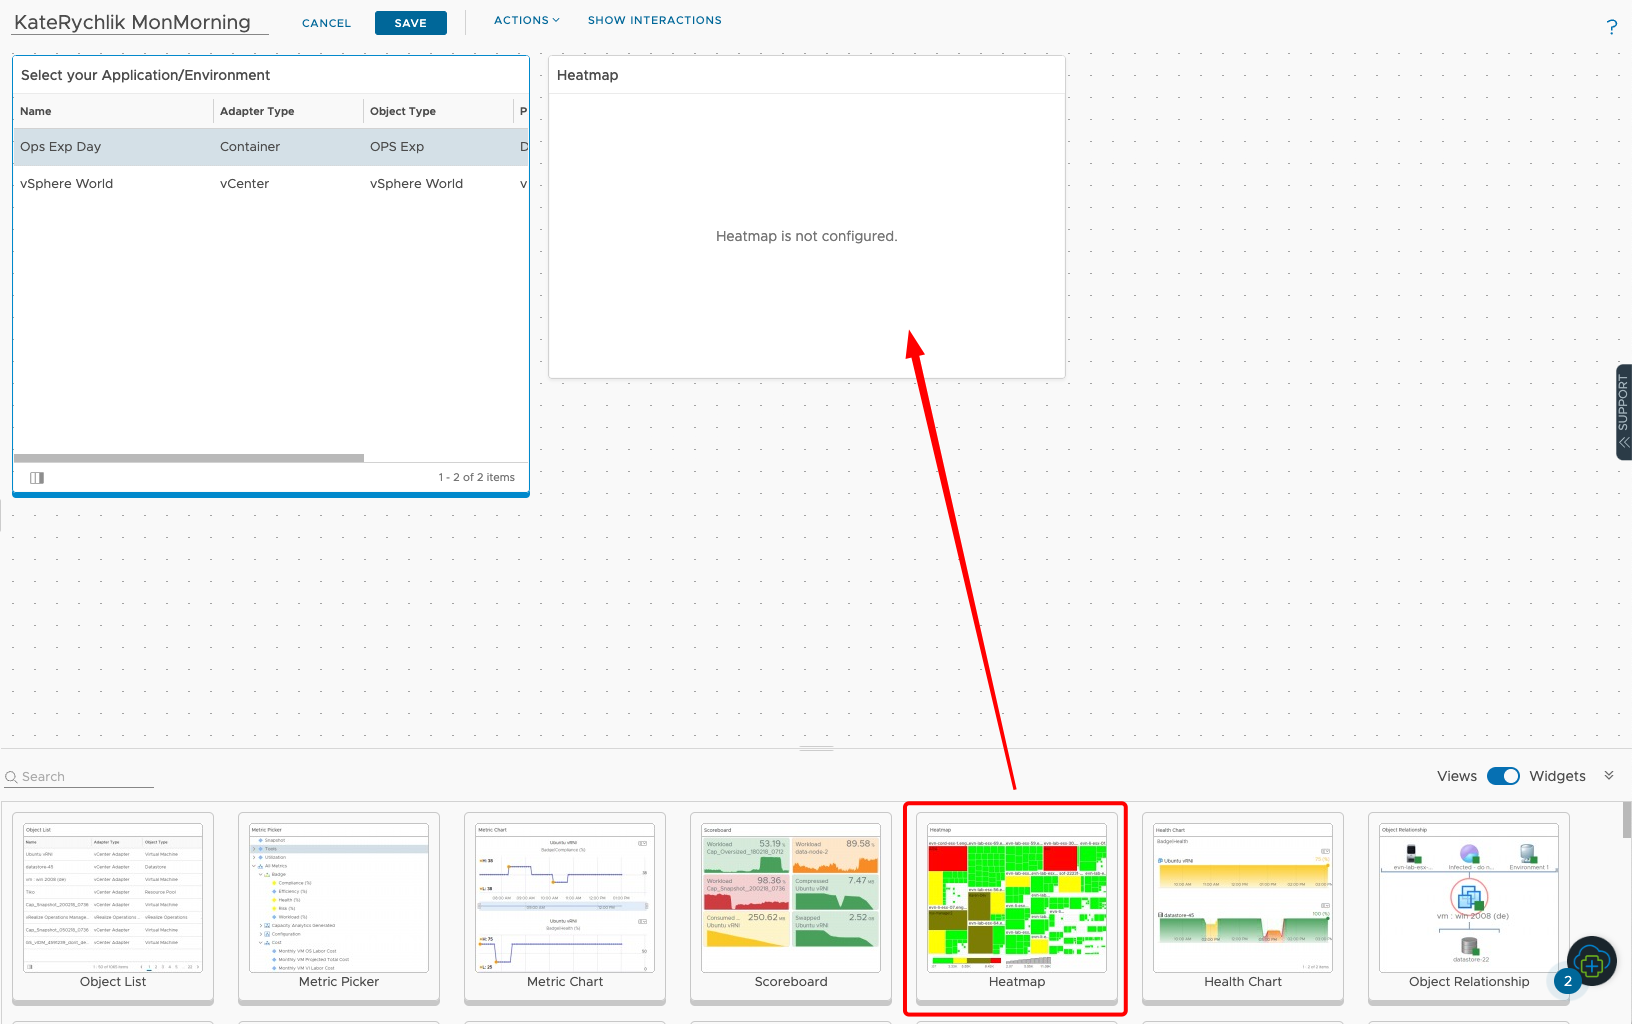
Dropdown Heatmap widget to canvas and click on pencil icon to edit.
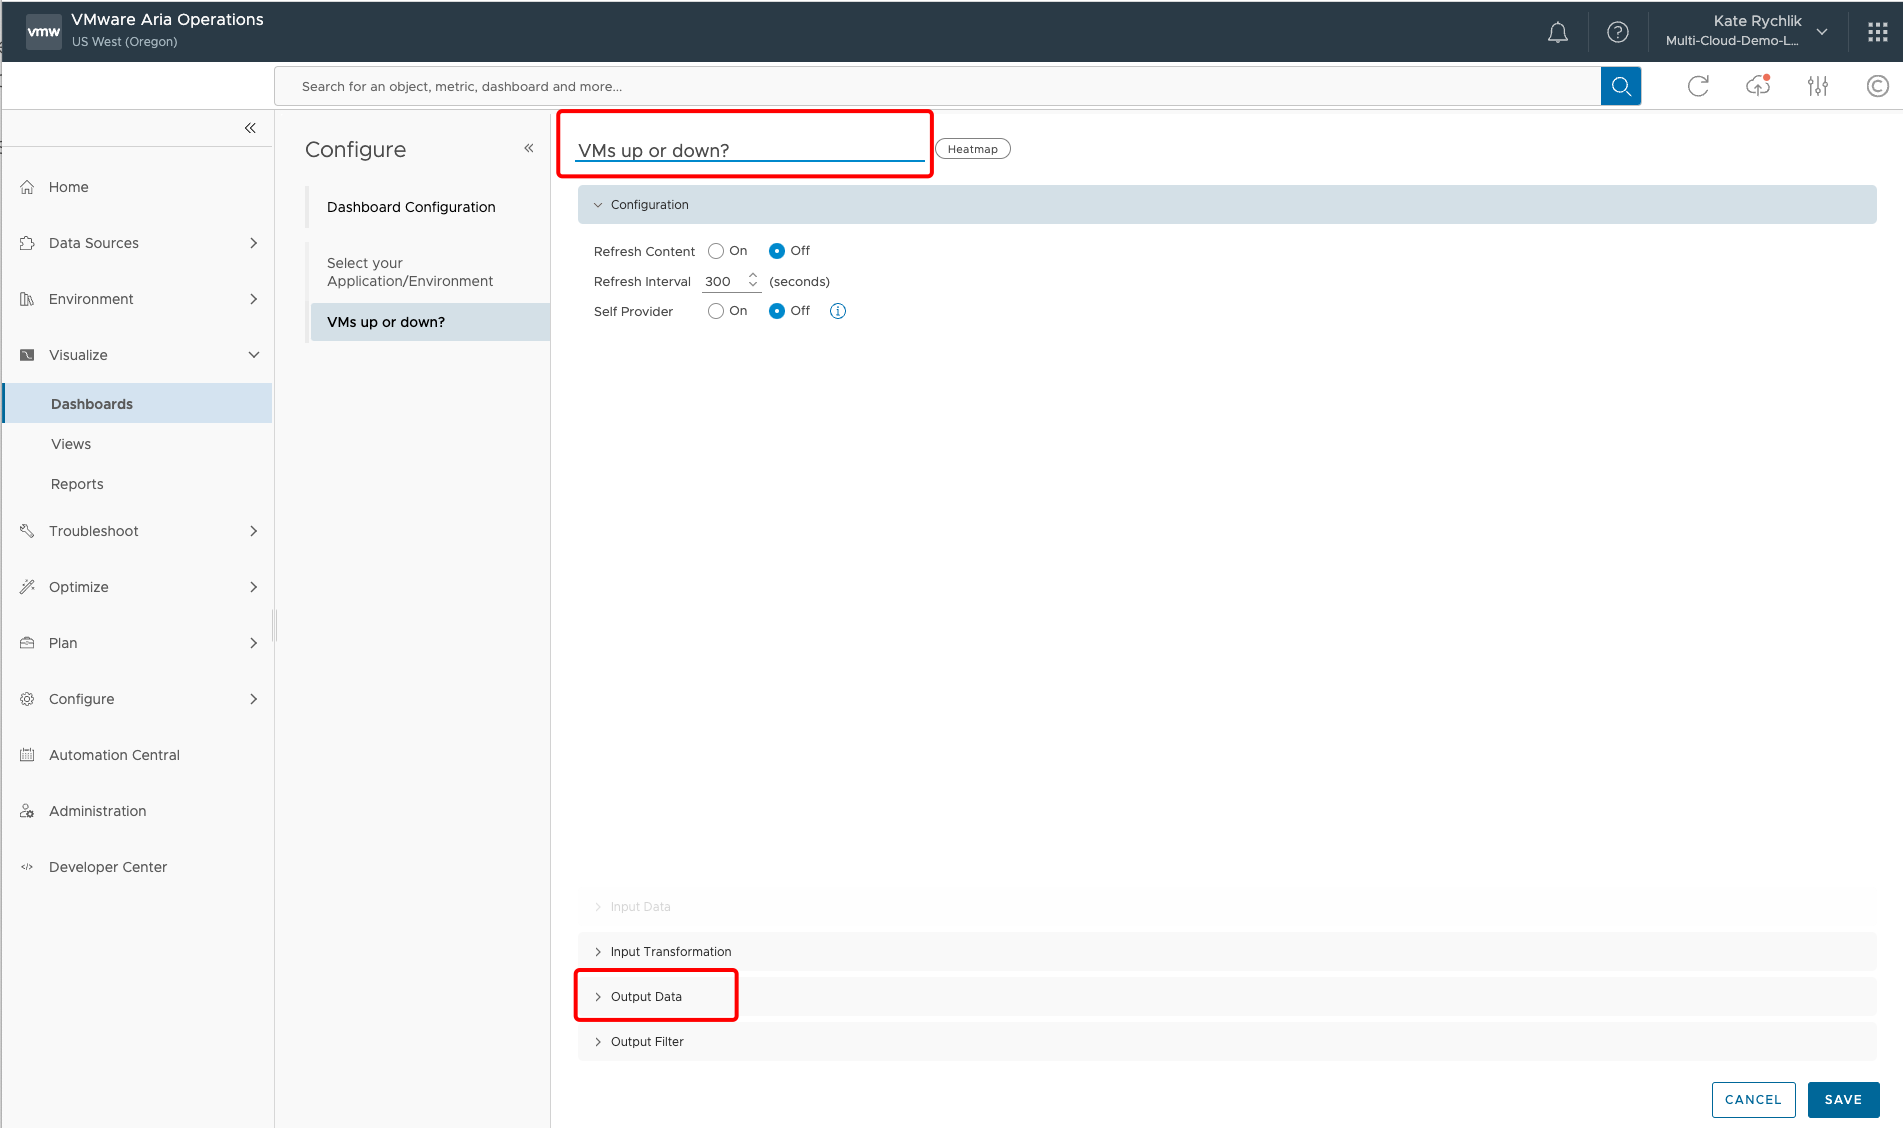
- Rename to “VMs up or down?”.
- Click on >Output Data.
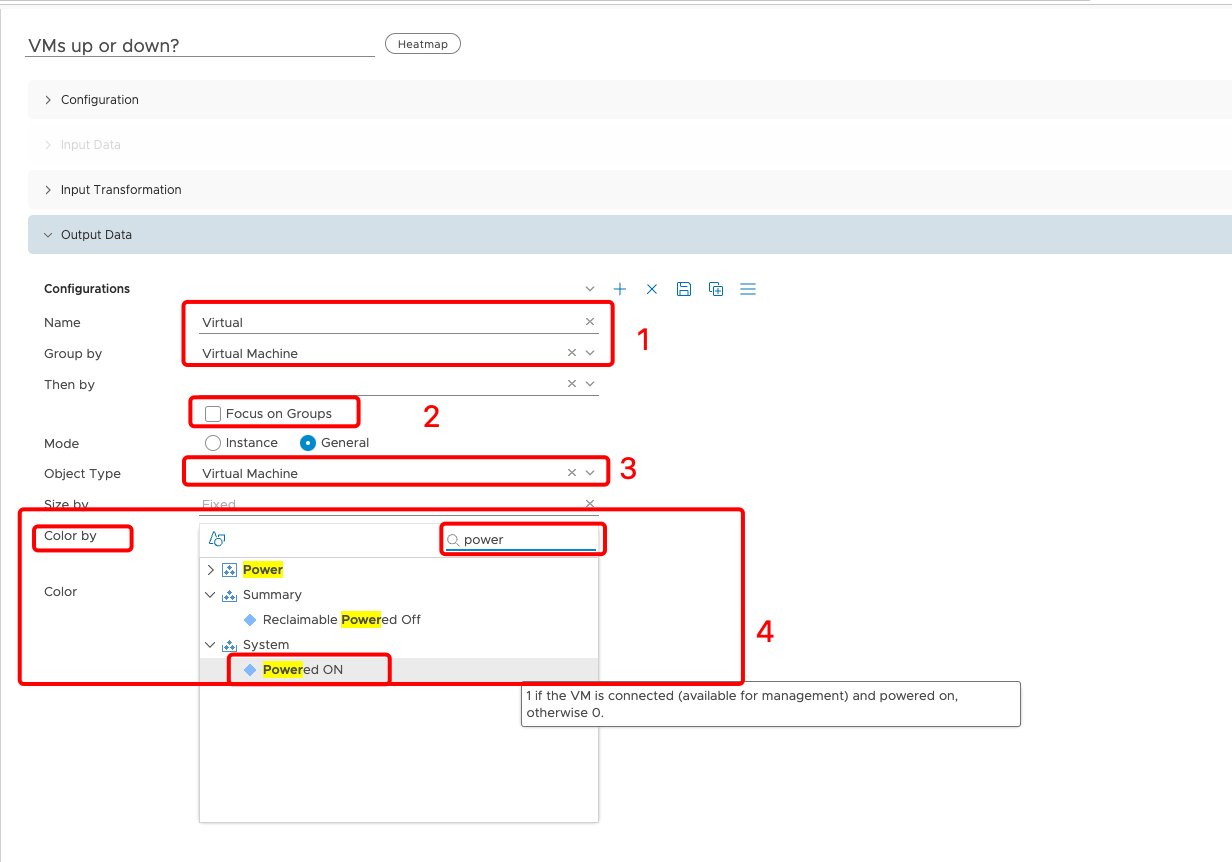
In the Output Data widow:
- Type a configuration Name: Virtual and select Group by Virtual Machine.
- Uncheck Focus on Groups.
- Select Object Type Virtual Machine.
- Select Color by in search field type Powered ON - click on the metric.
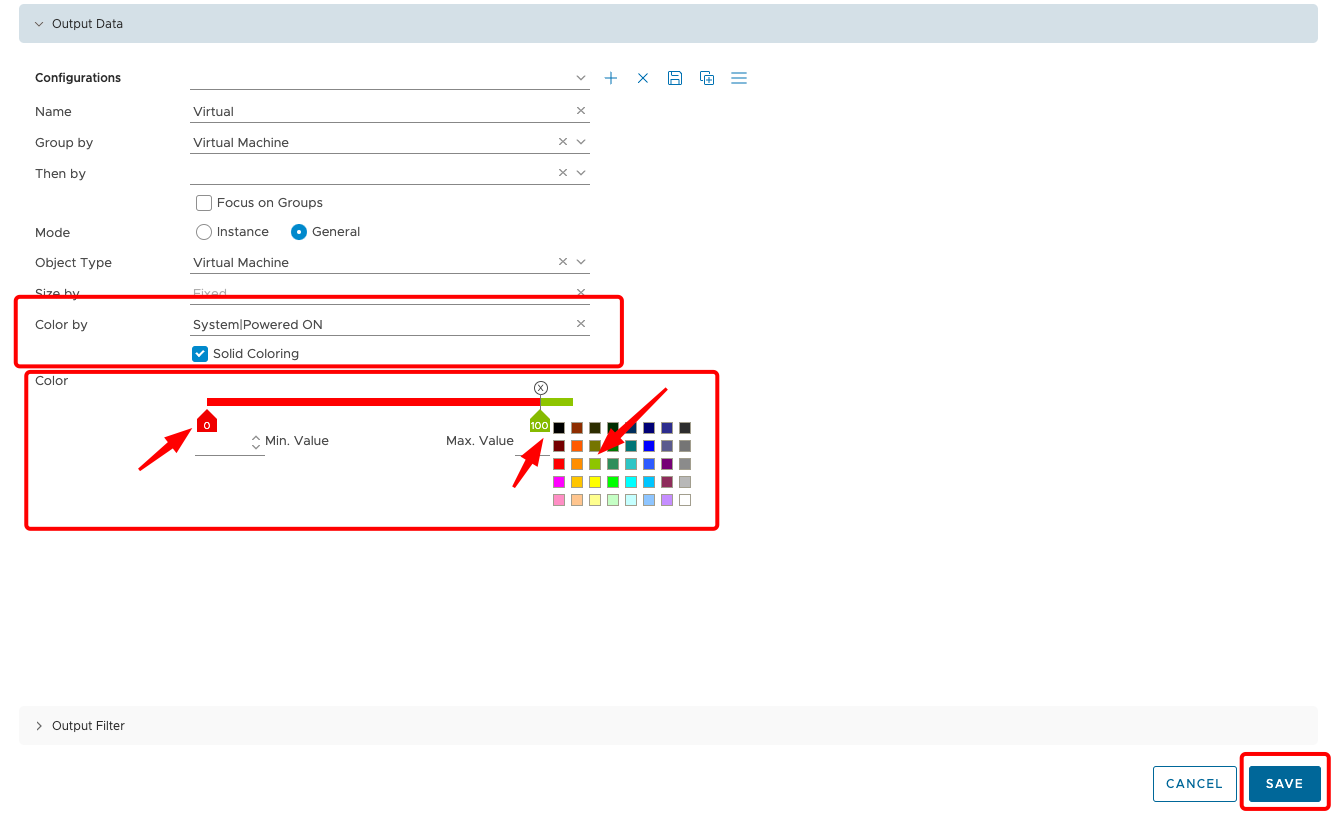
- Check Solid Coloring.
- Choose only 2 values on the graph. Select RED color for 0 value and GREEN for 100 vaule.
- Click SAVE.
Select multiple default widgets
VMware Aria Operations offers default widgets that represent set of data, those widgets usually do not require changes.
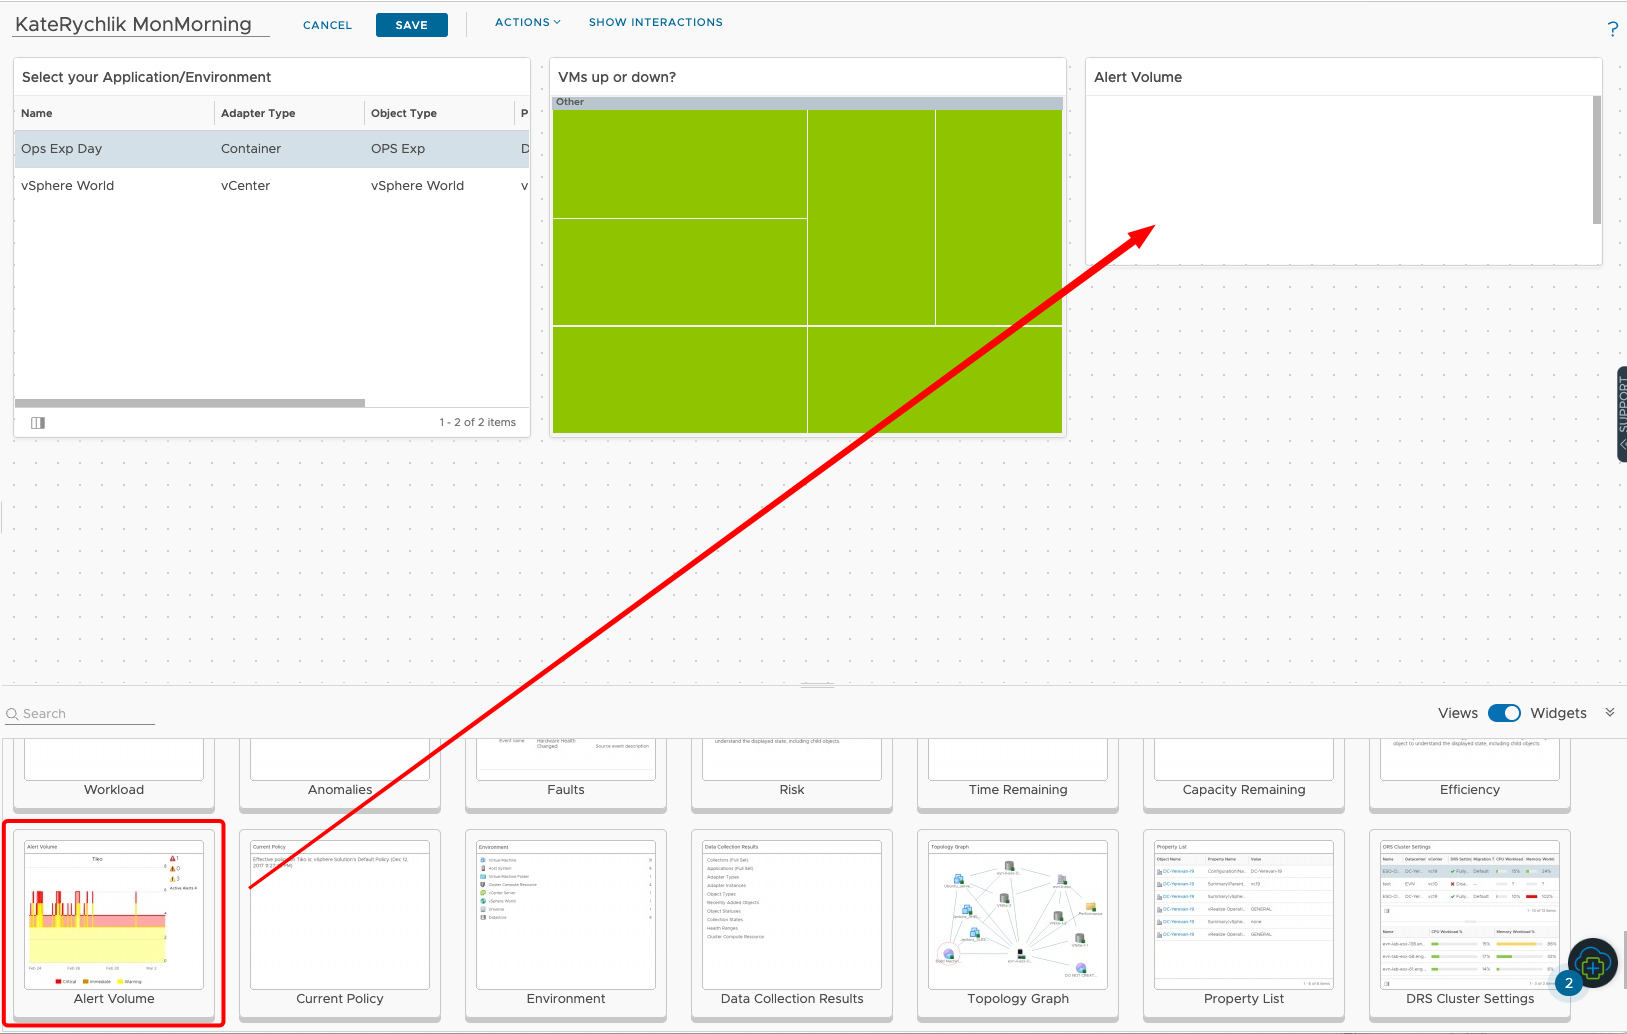
Drop Alert Volume widget and make it smaller than previous widget.
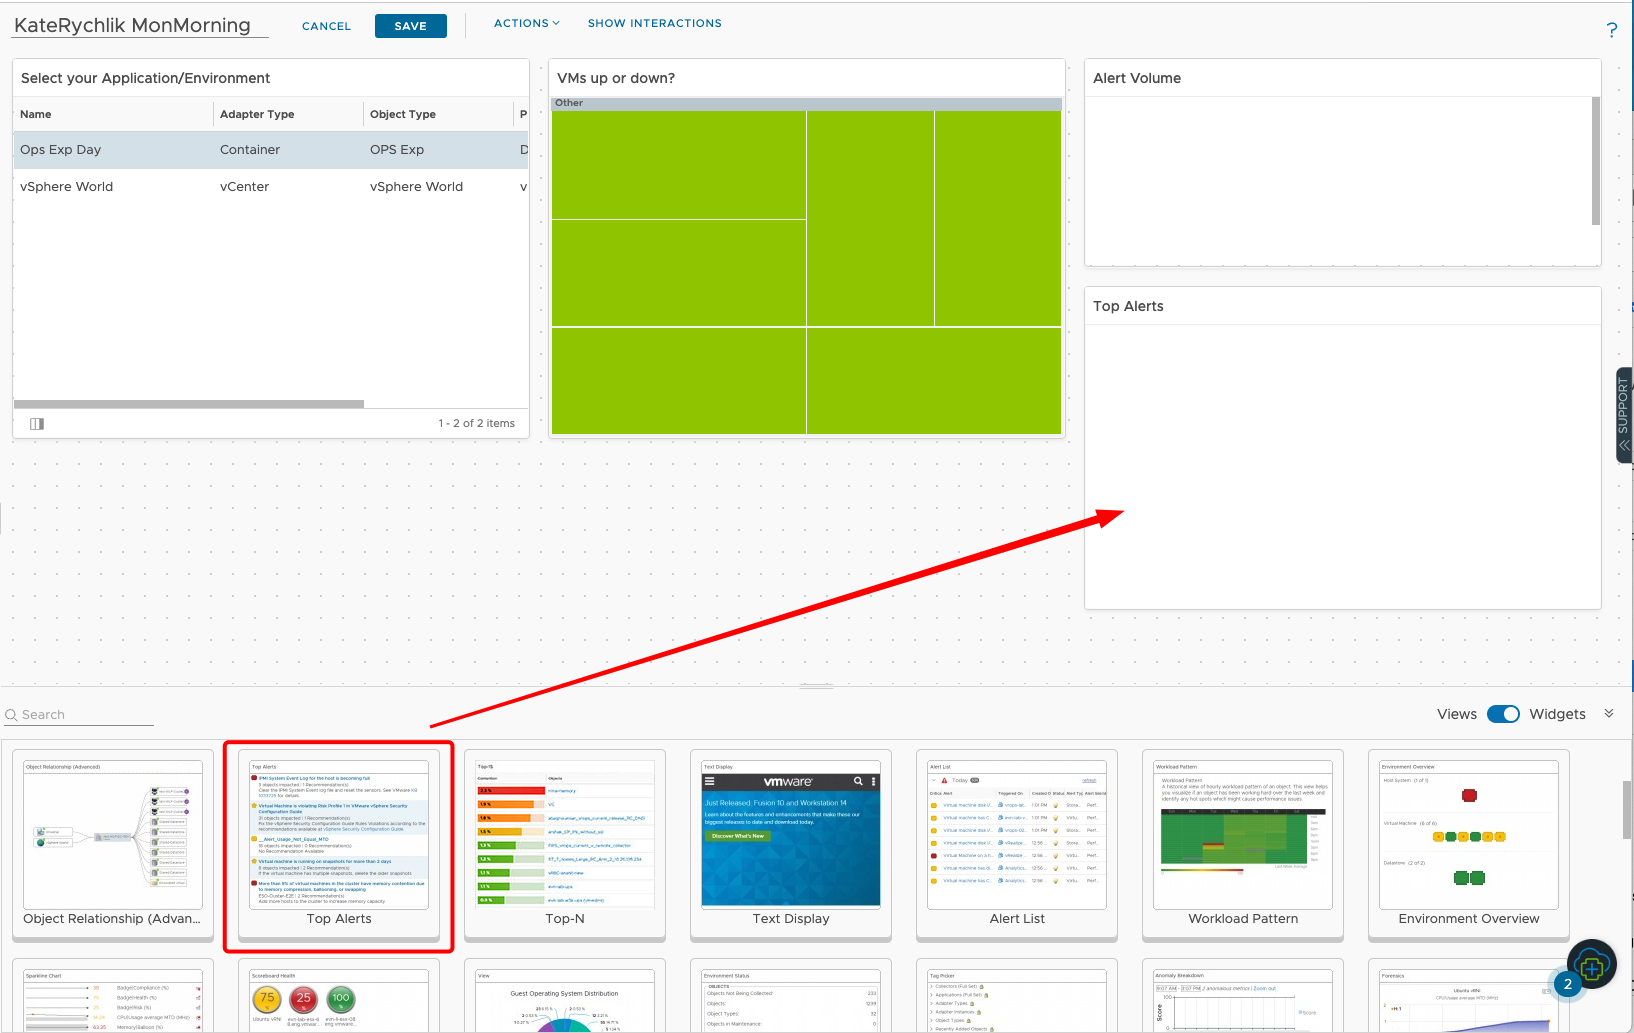
Drop Top Alerts widget and make it smaller.
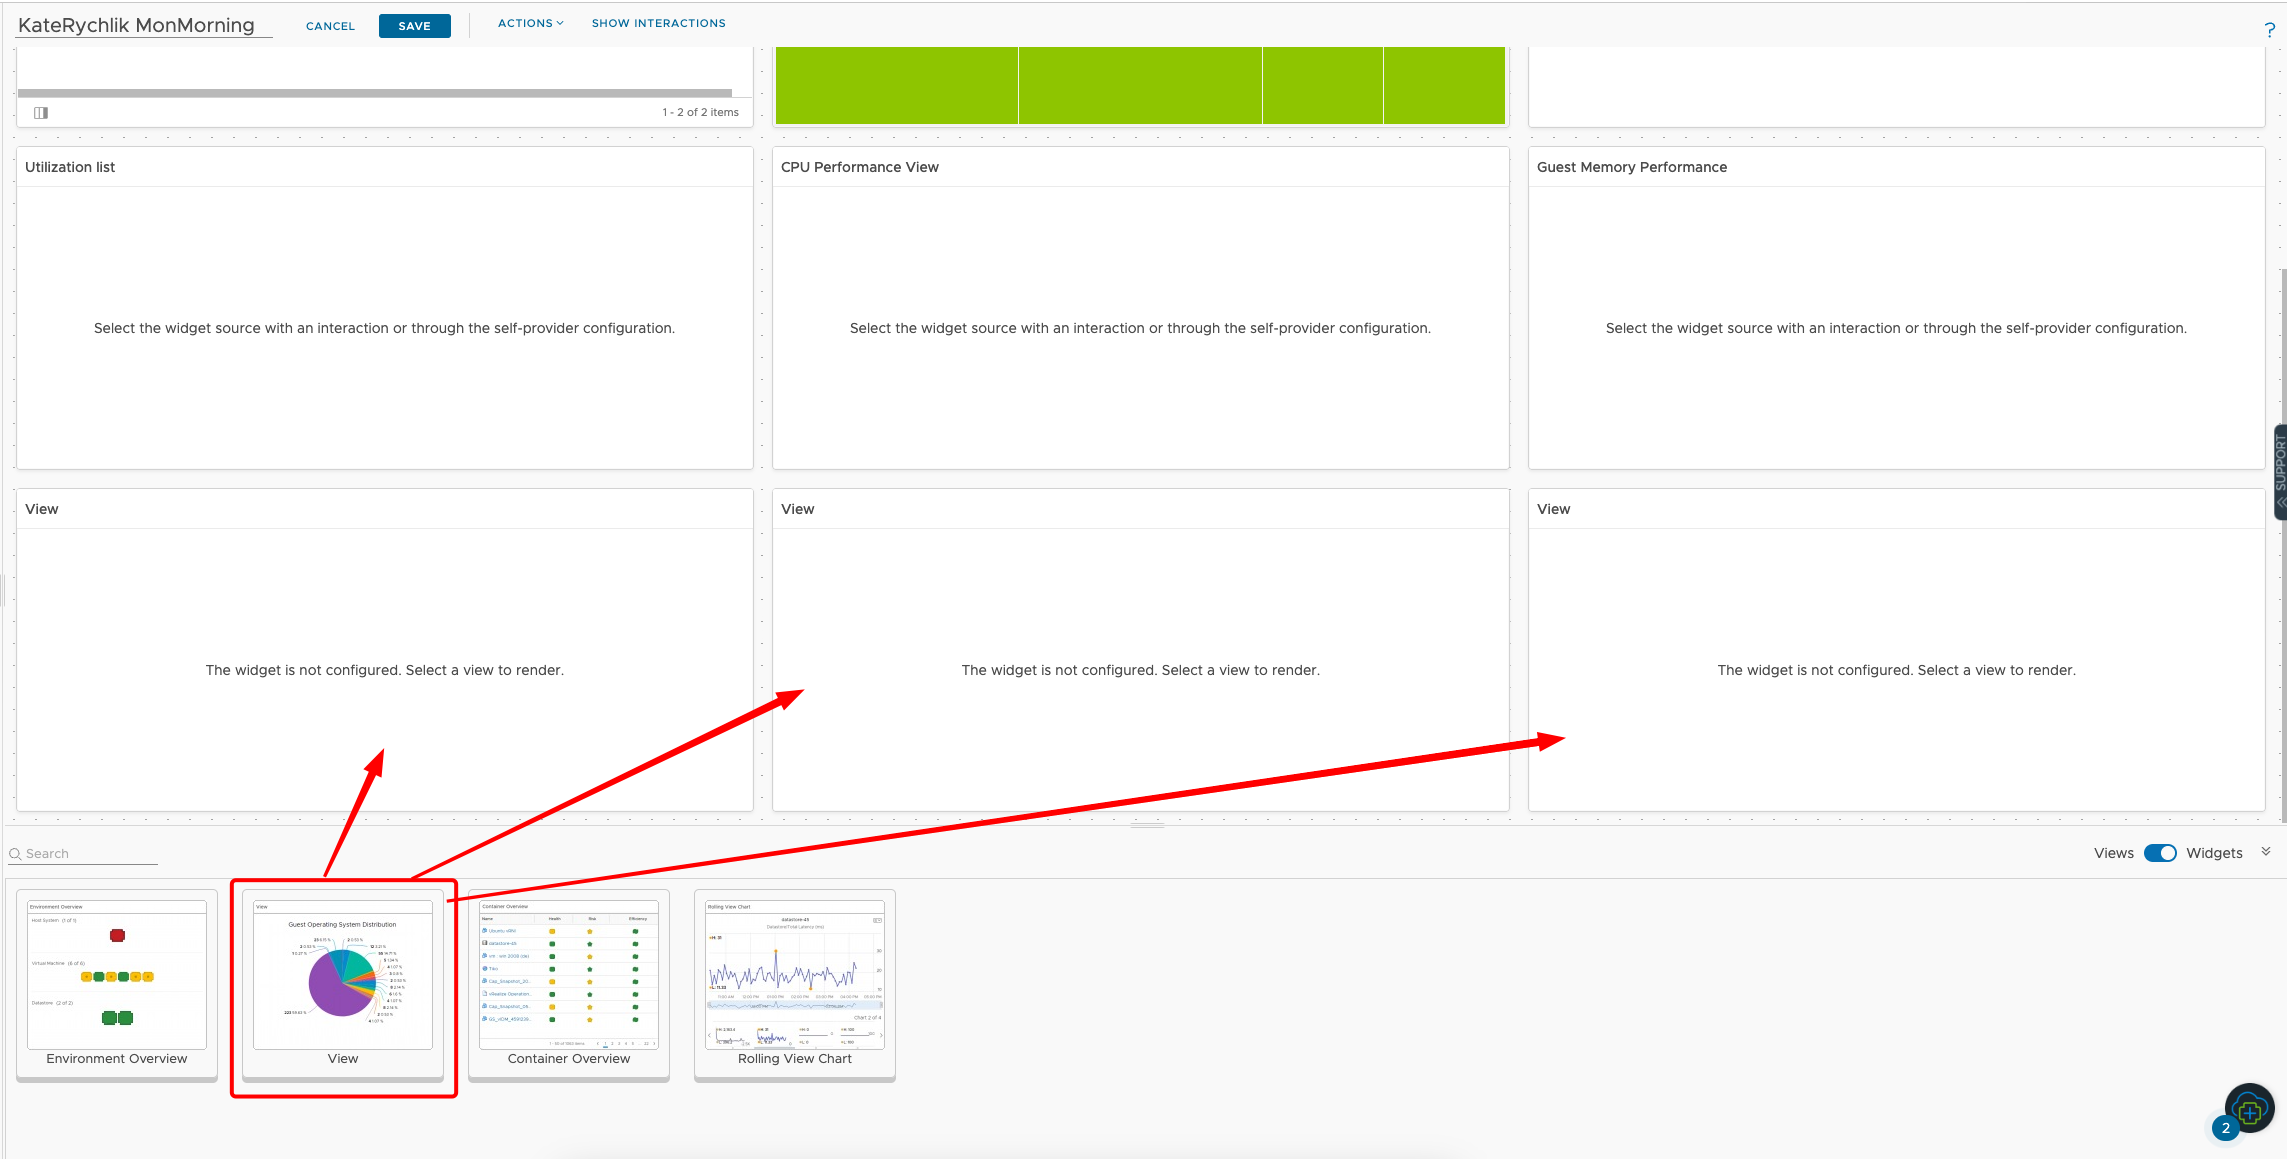
View widget
The key component of a Report or a Dashboard is a View. A View helps you interpret data (such as metrics, properties, policies and symptoms) from a number of perspectives. Those perspectives can be transformed to highlight how the data has historically changed (trend) or how the data may look in the future (forecast) built on the historical trend.In this module we will walk through the creation of custom views in VMware Aria Operations. Successfully creating custom views will ensure we can use VMware Aria Operations to track what is important/critical to the monitoring of our VMware Cloud Infrastructure.
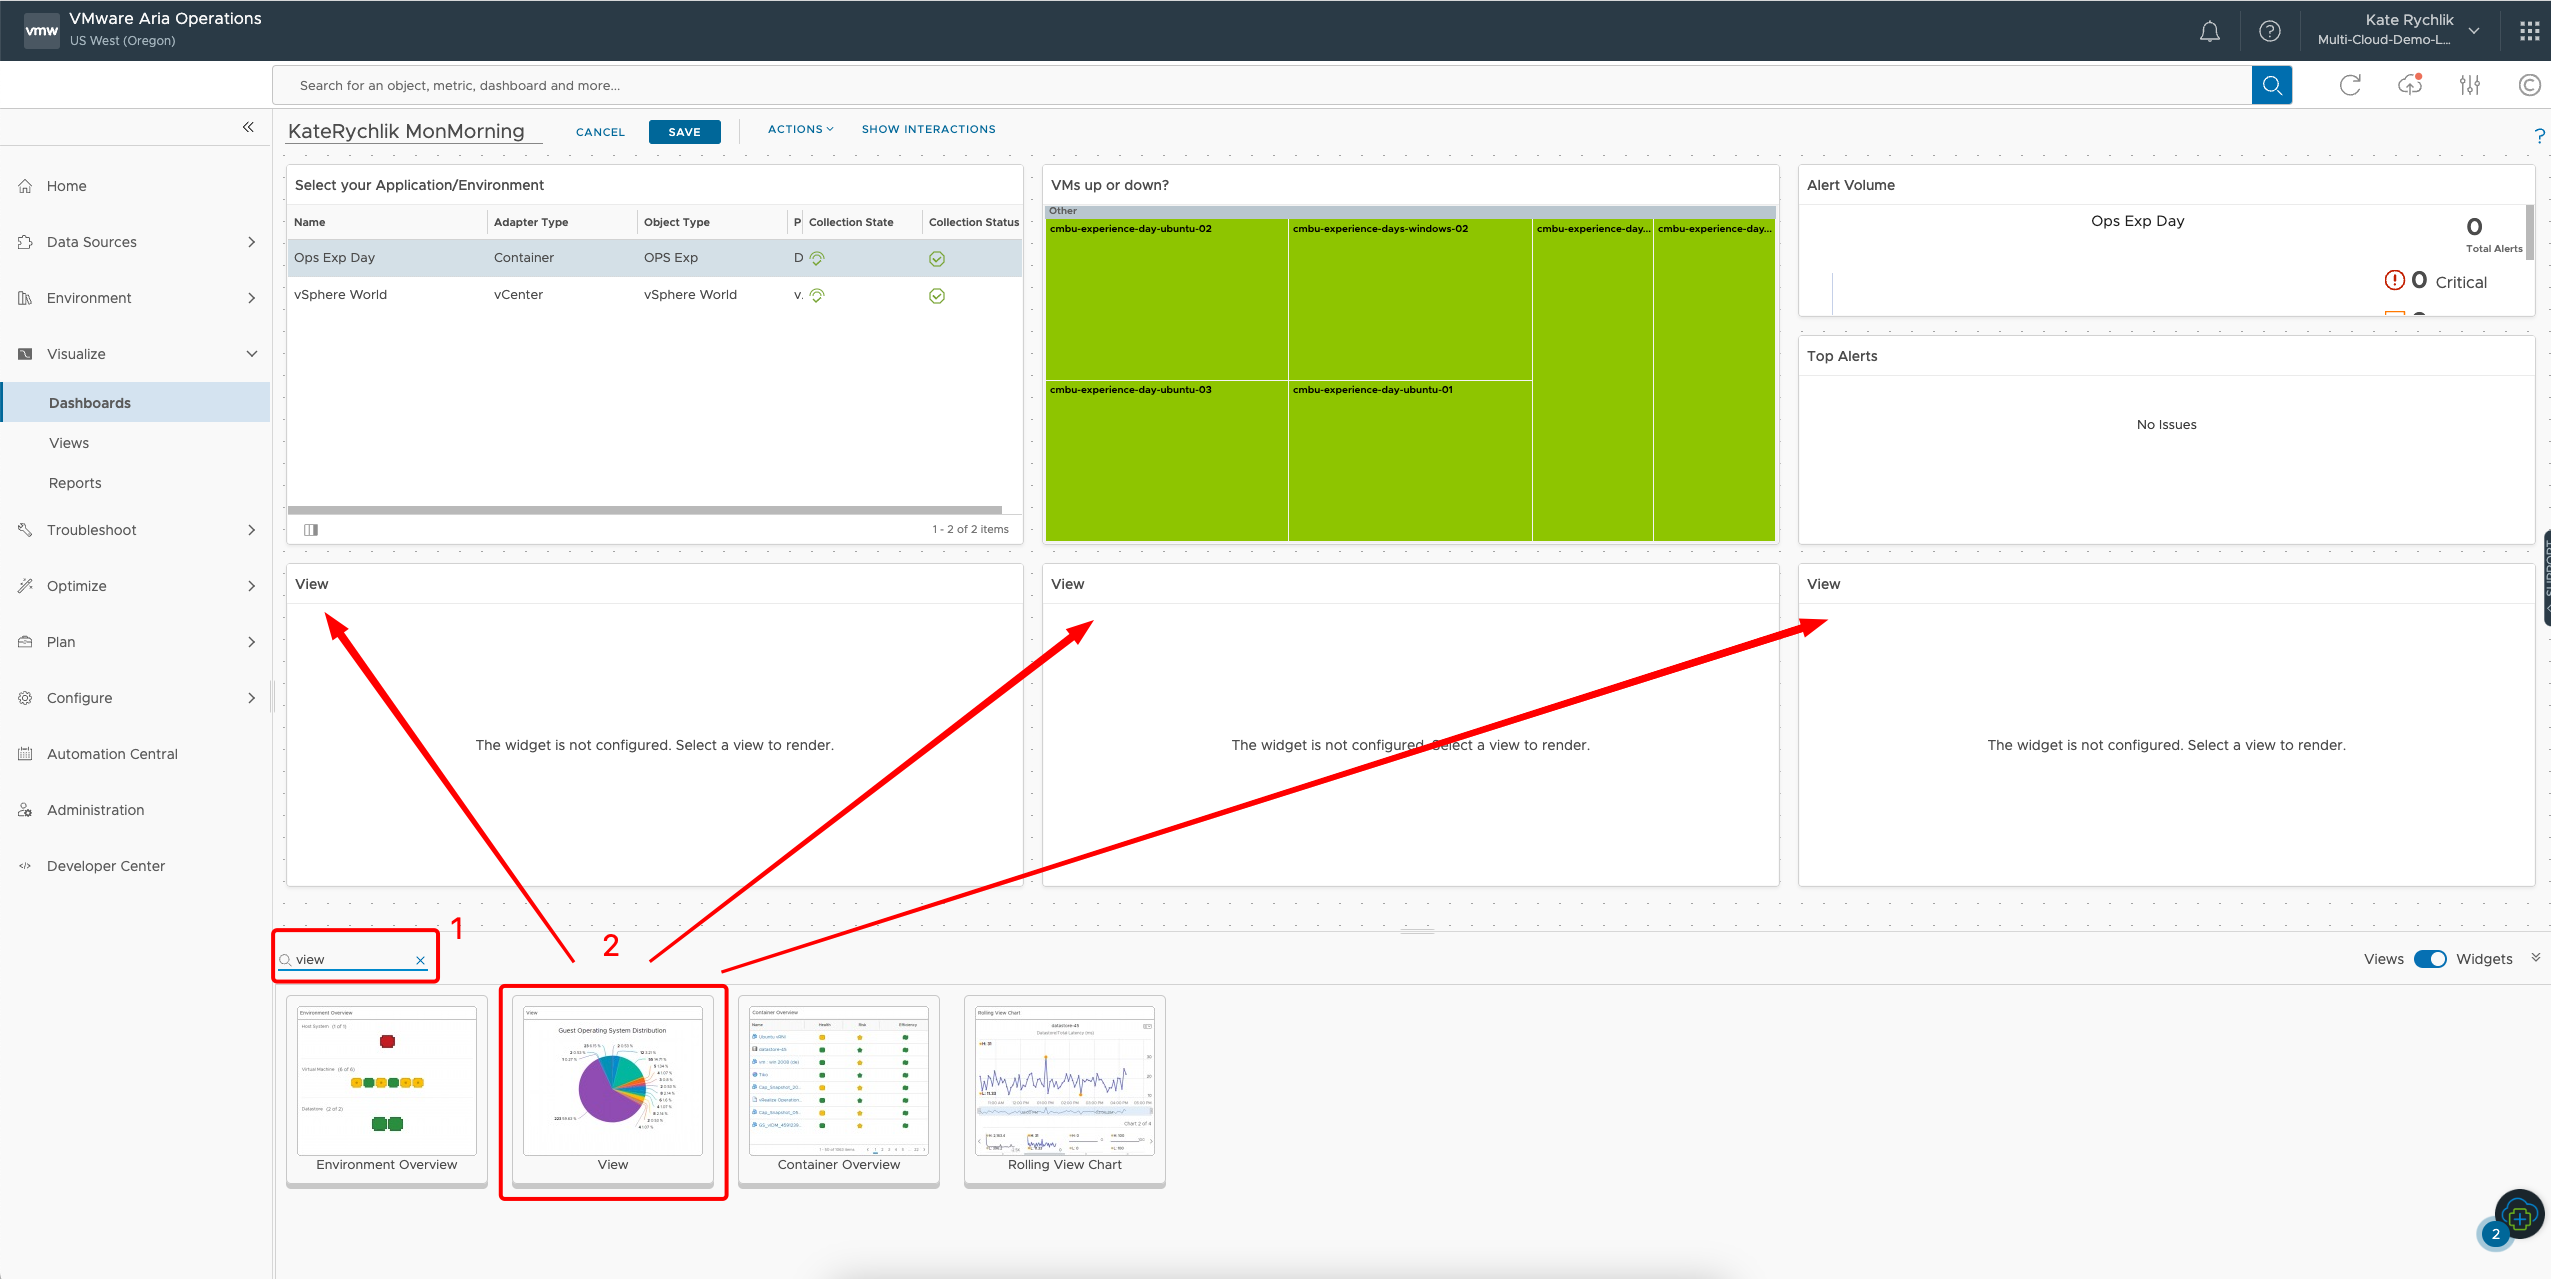
- Type view in search field
- Drop few View widgets.
- Click Pencil icon to edit.
Utlization list
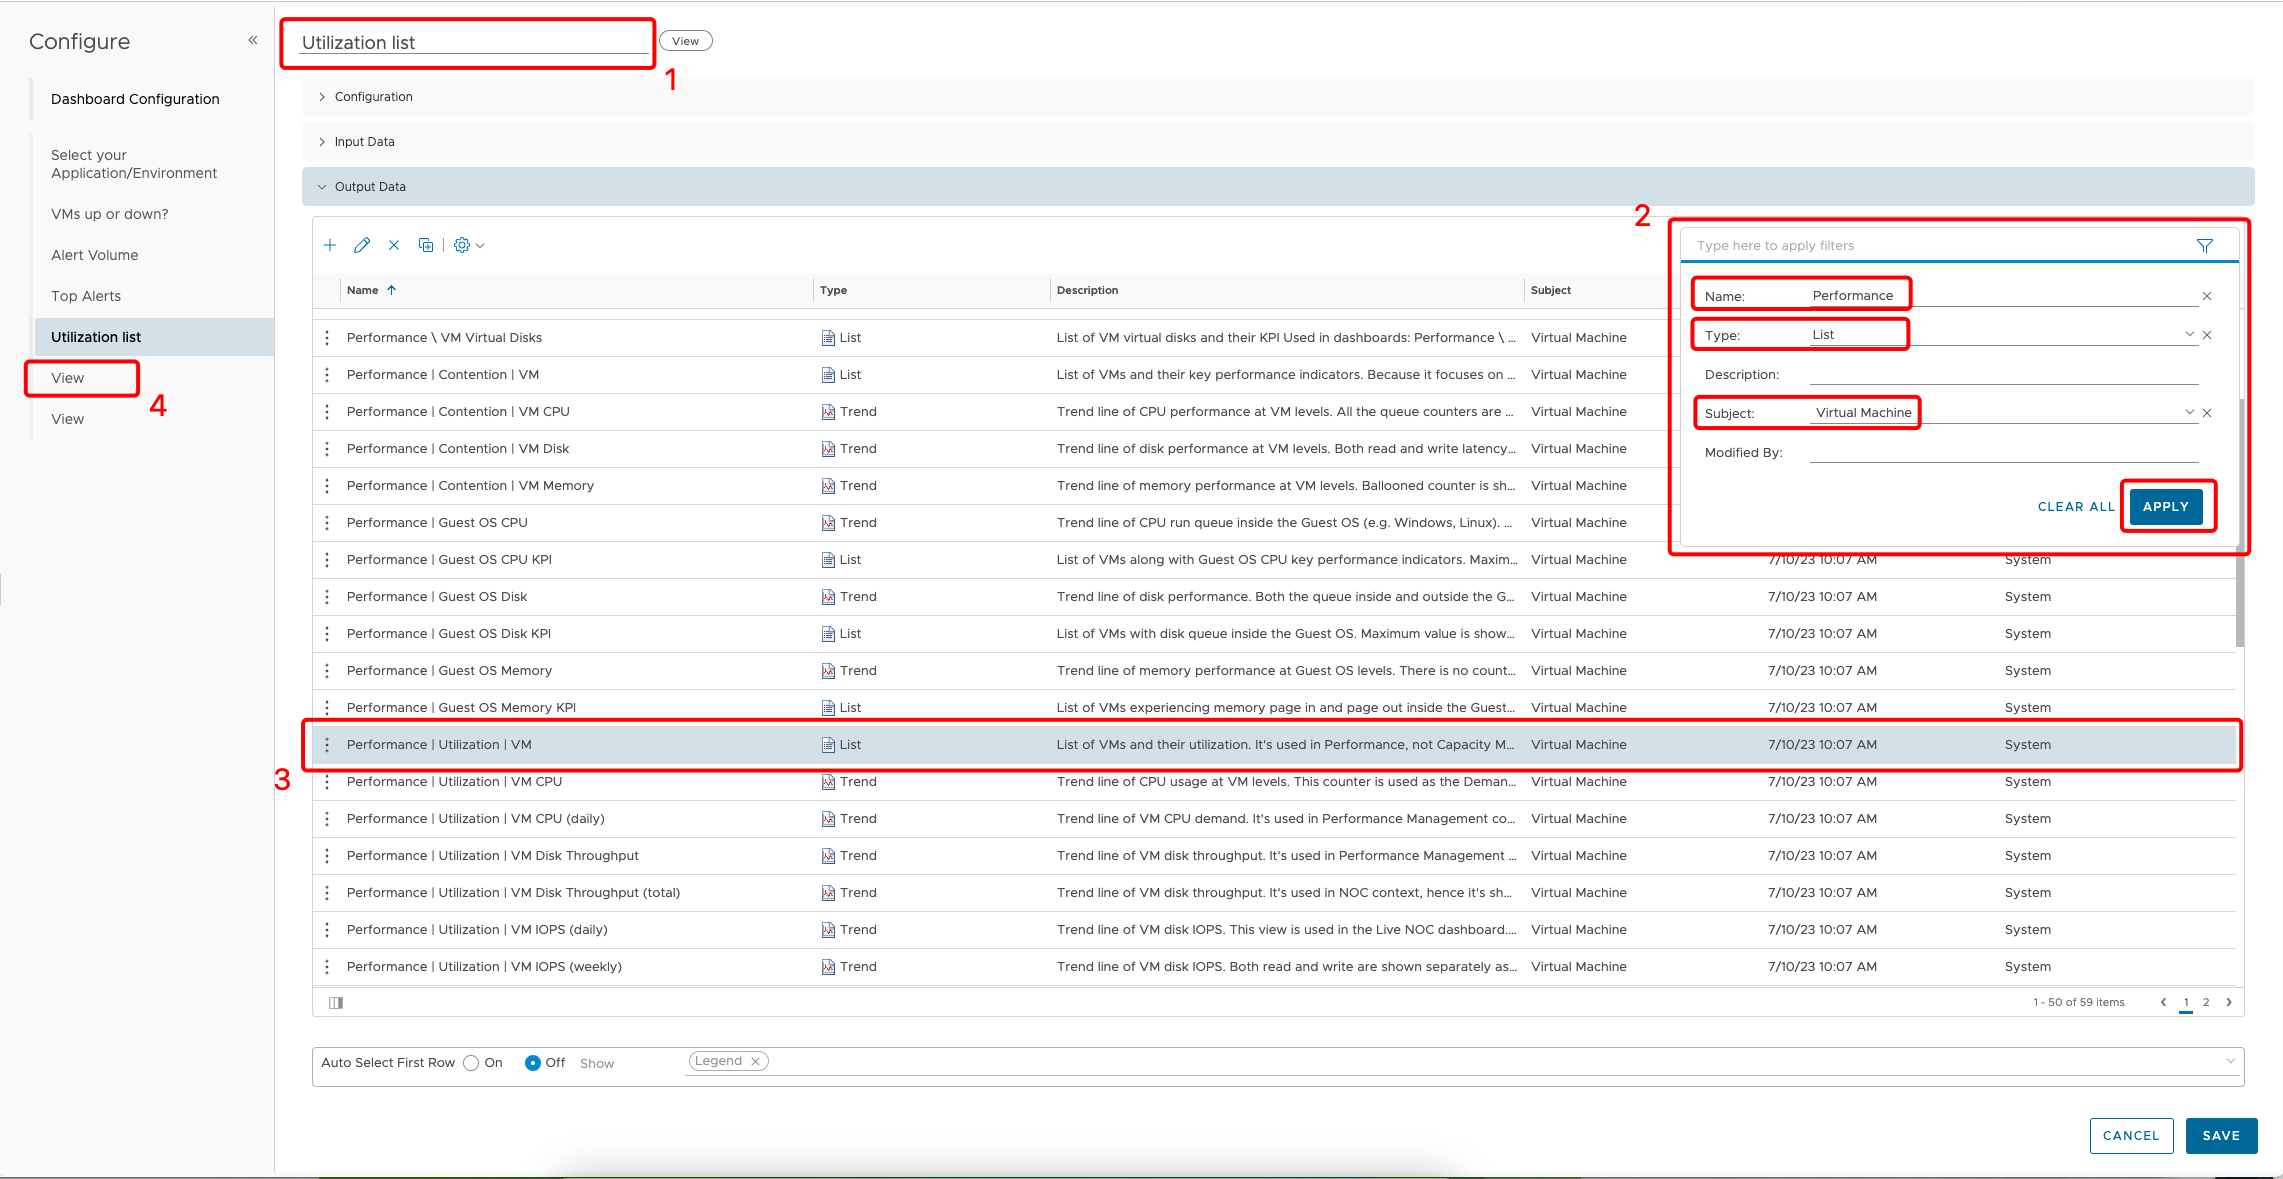
- Change the name to “Utilization list”.
-
Select funnel icon to use filter option:
- Name: Performance
- Type: List
- Subject: Virtual Machine
Click on APPLY.
-
Find and select **Performance Utilization VM** view.
NOTE: Make sure that after selecting the row will change color.
- Click on View on the left panel to edit next widget.
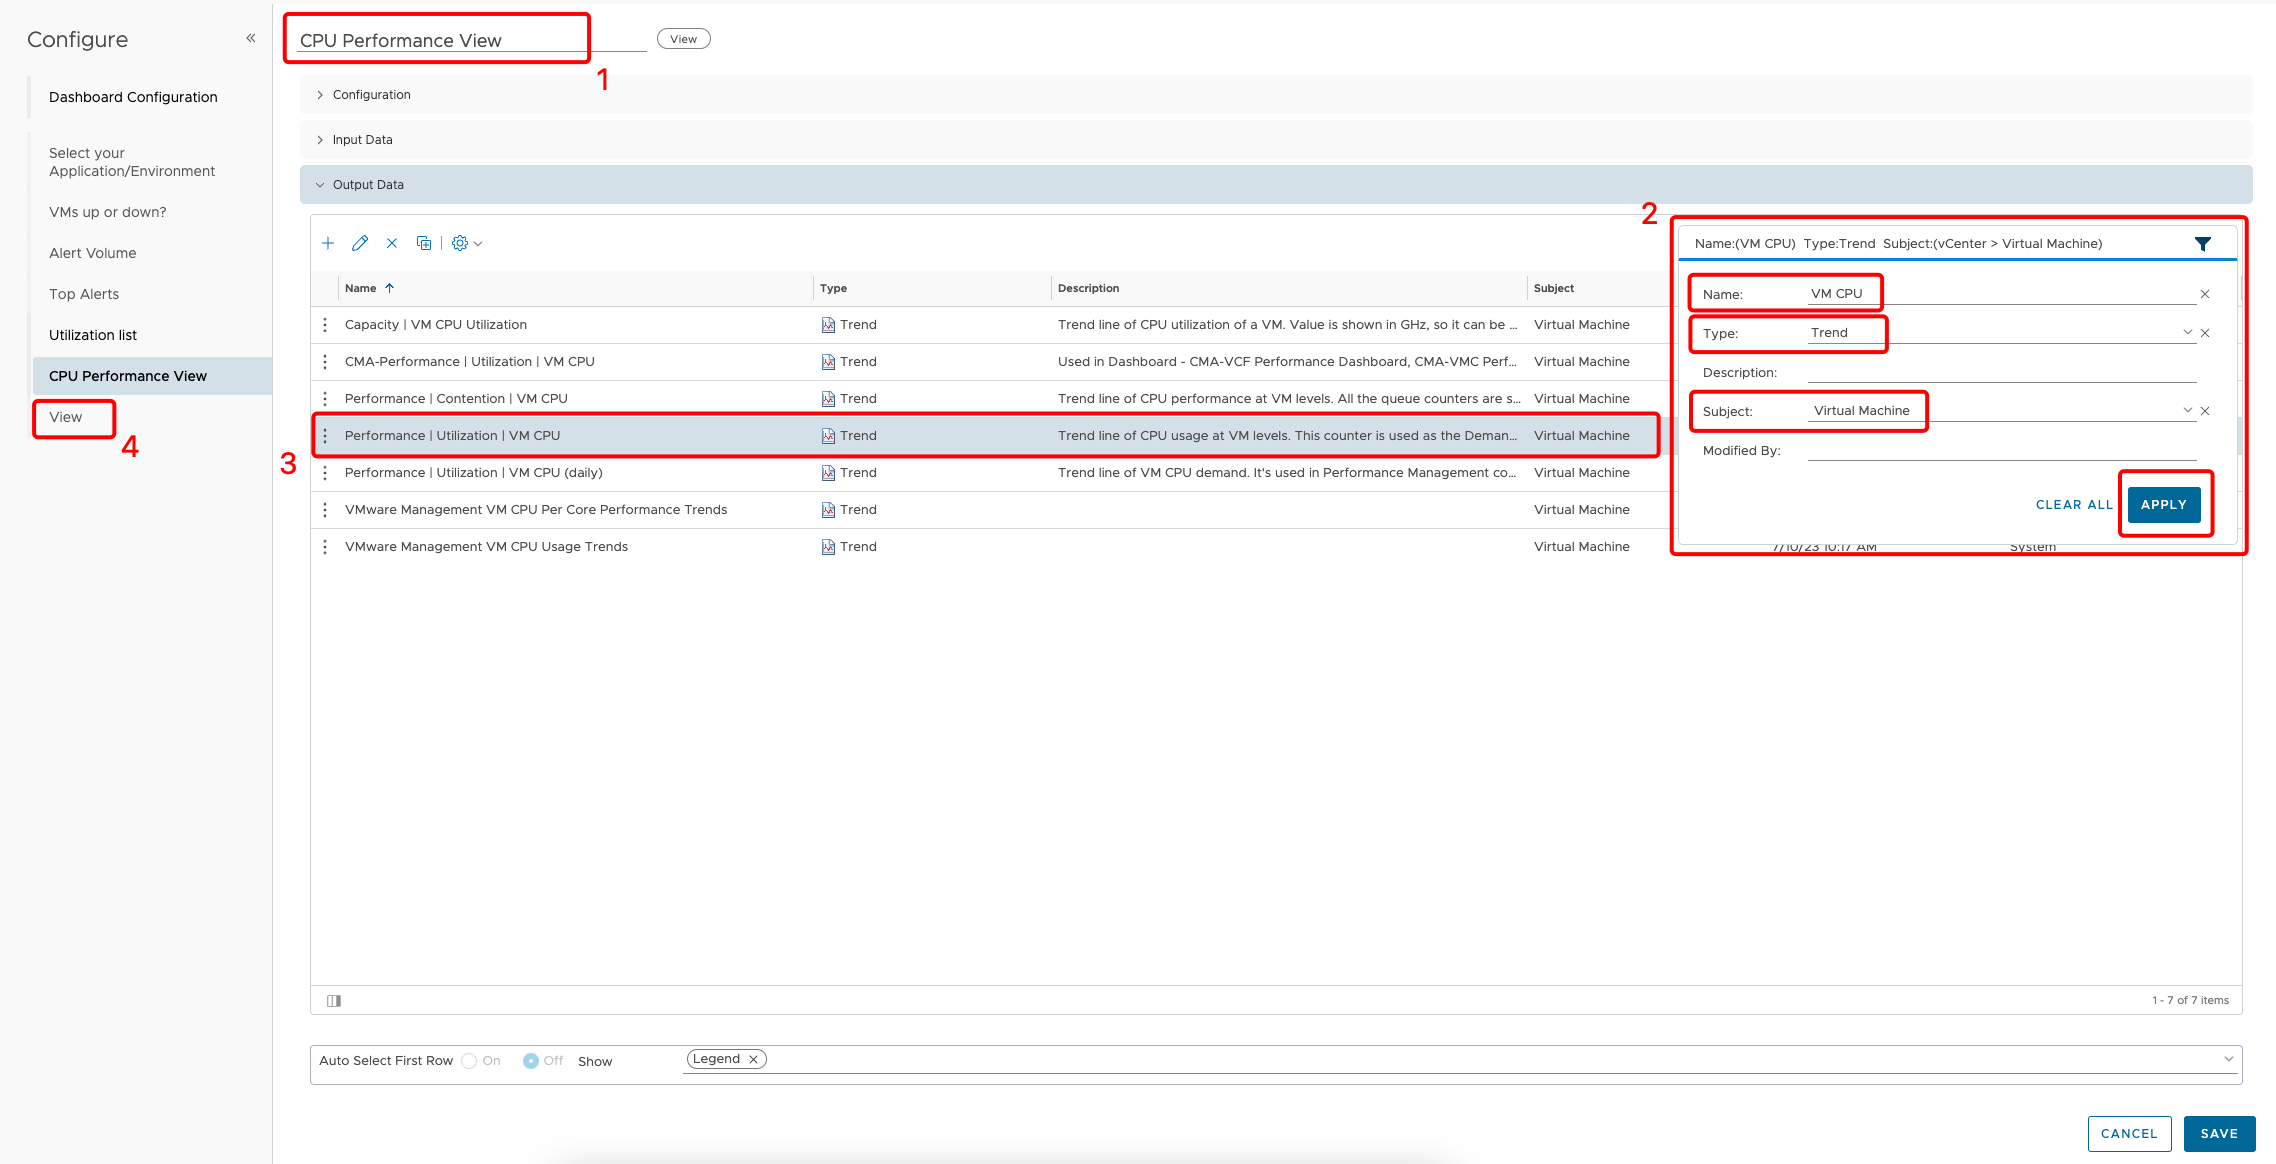
CPU Performance View
-
Change the name to “CPU Performance View”.
-
Select funnel icon to use filter option:
- Name: VM CPU
- Type: Trend
- Subject: Virtual Machine
Click on APPLY.
-
Find and select **Performance Utilization VM CPU** view. - Click on View on the left panel to edit next widget.
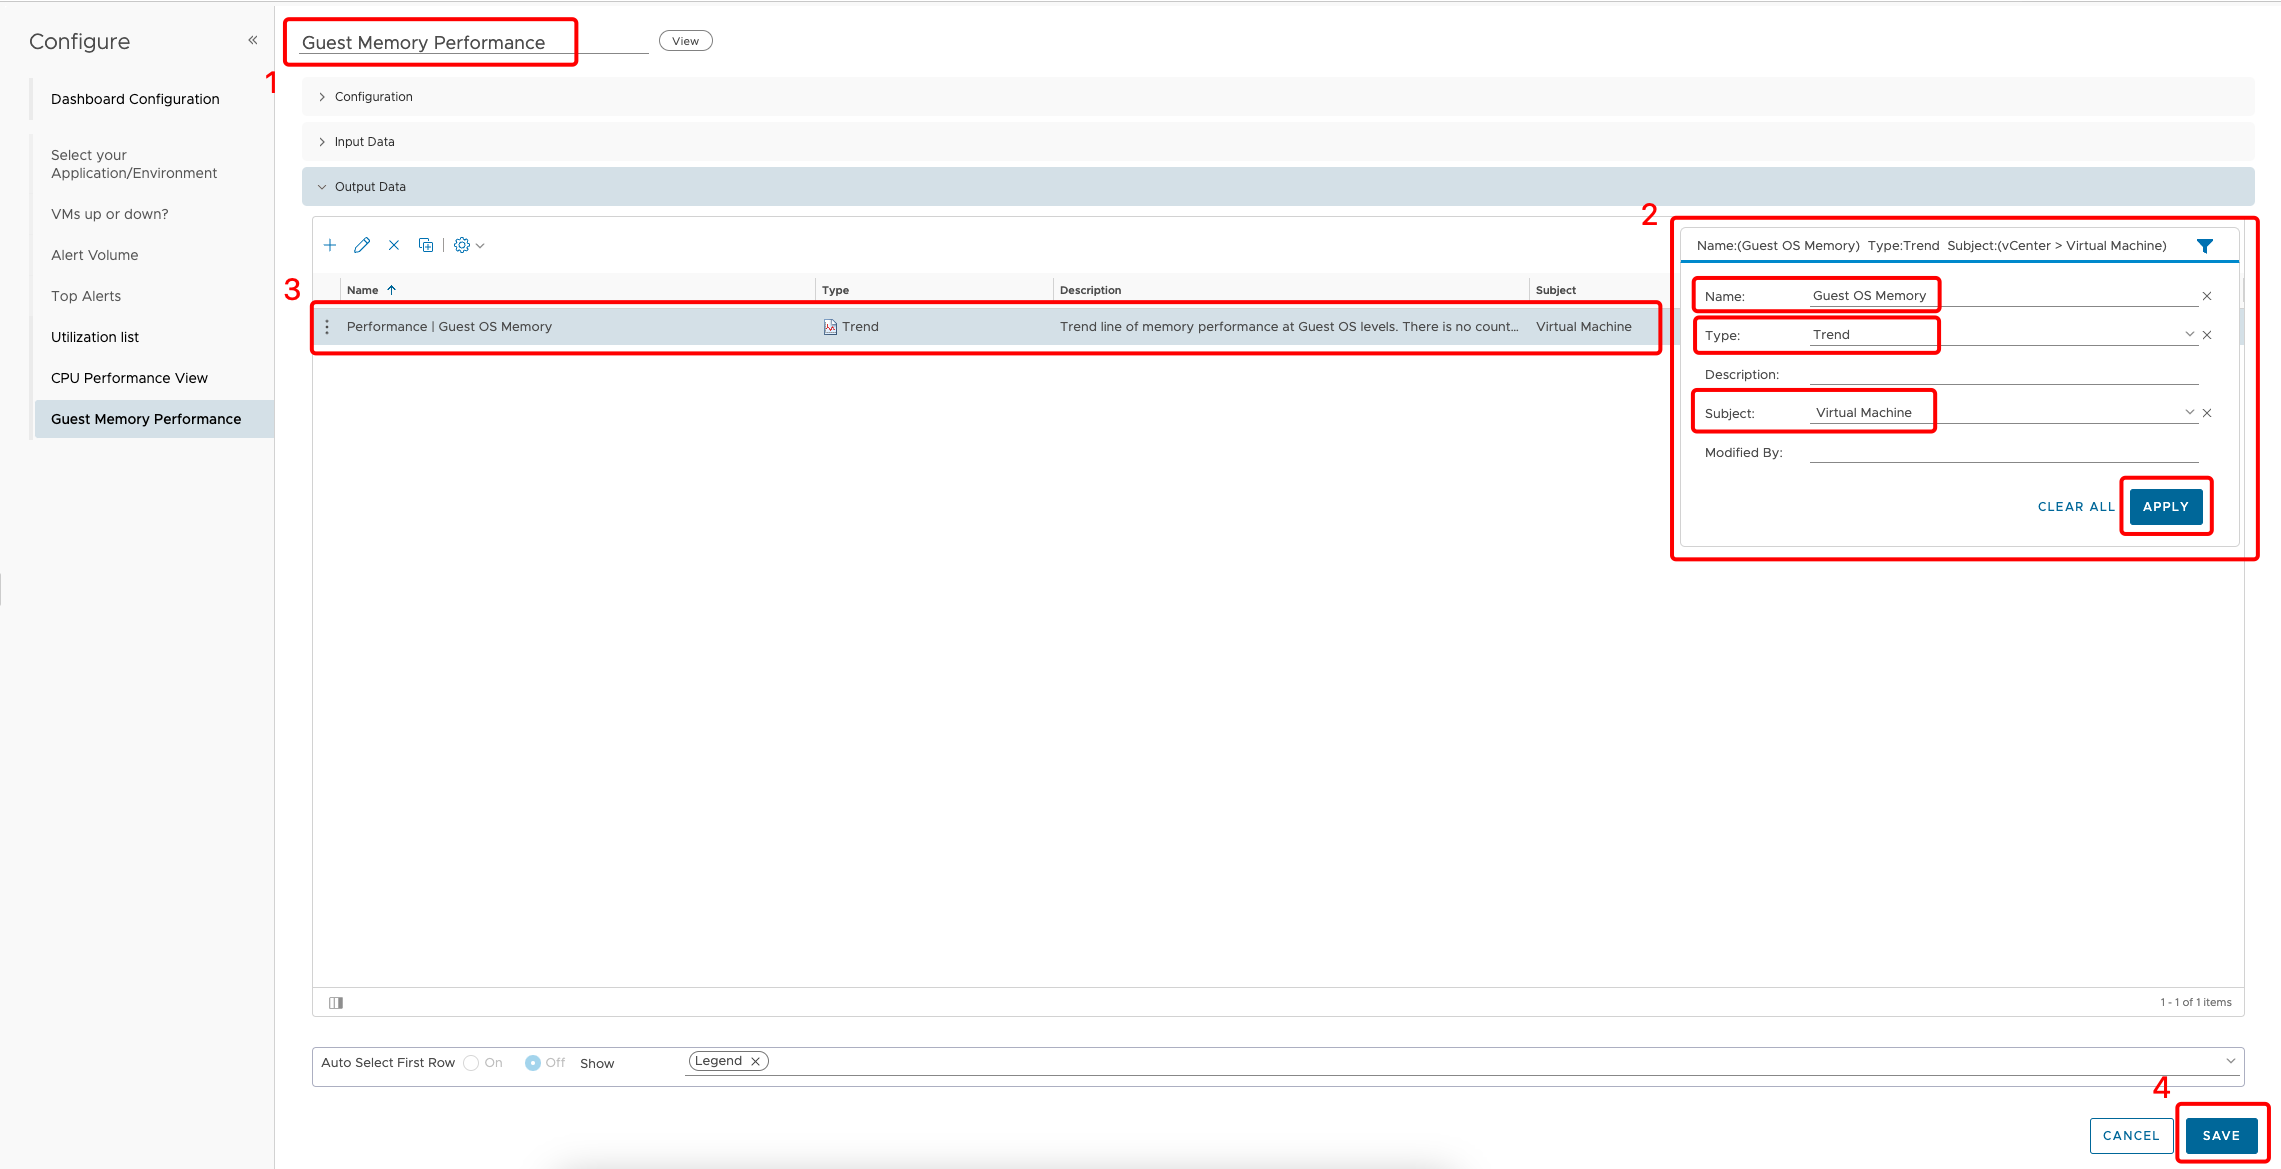
Guest Memory Performance
-
Change the name to “Guest Memory Performance”.
-
Select funnel icon to use filter option:
- Name: Guest OS Memory
- Type: Trend
- Subject: Virtual Machine
Click on APPLY.
-
Find and select **Performance Guest OS Memory** view. - Click on SAVE.
Drop another 3 View widgets.
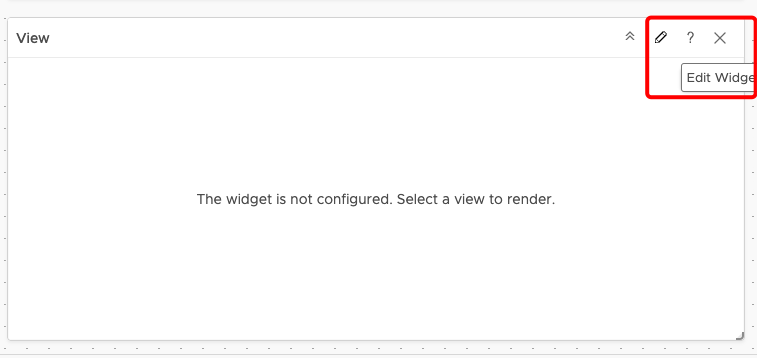
Click on Pencil icon to Edit Widget.
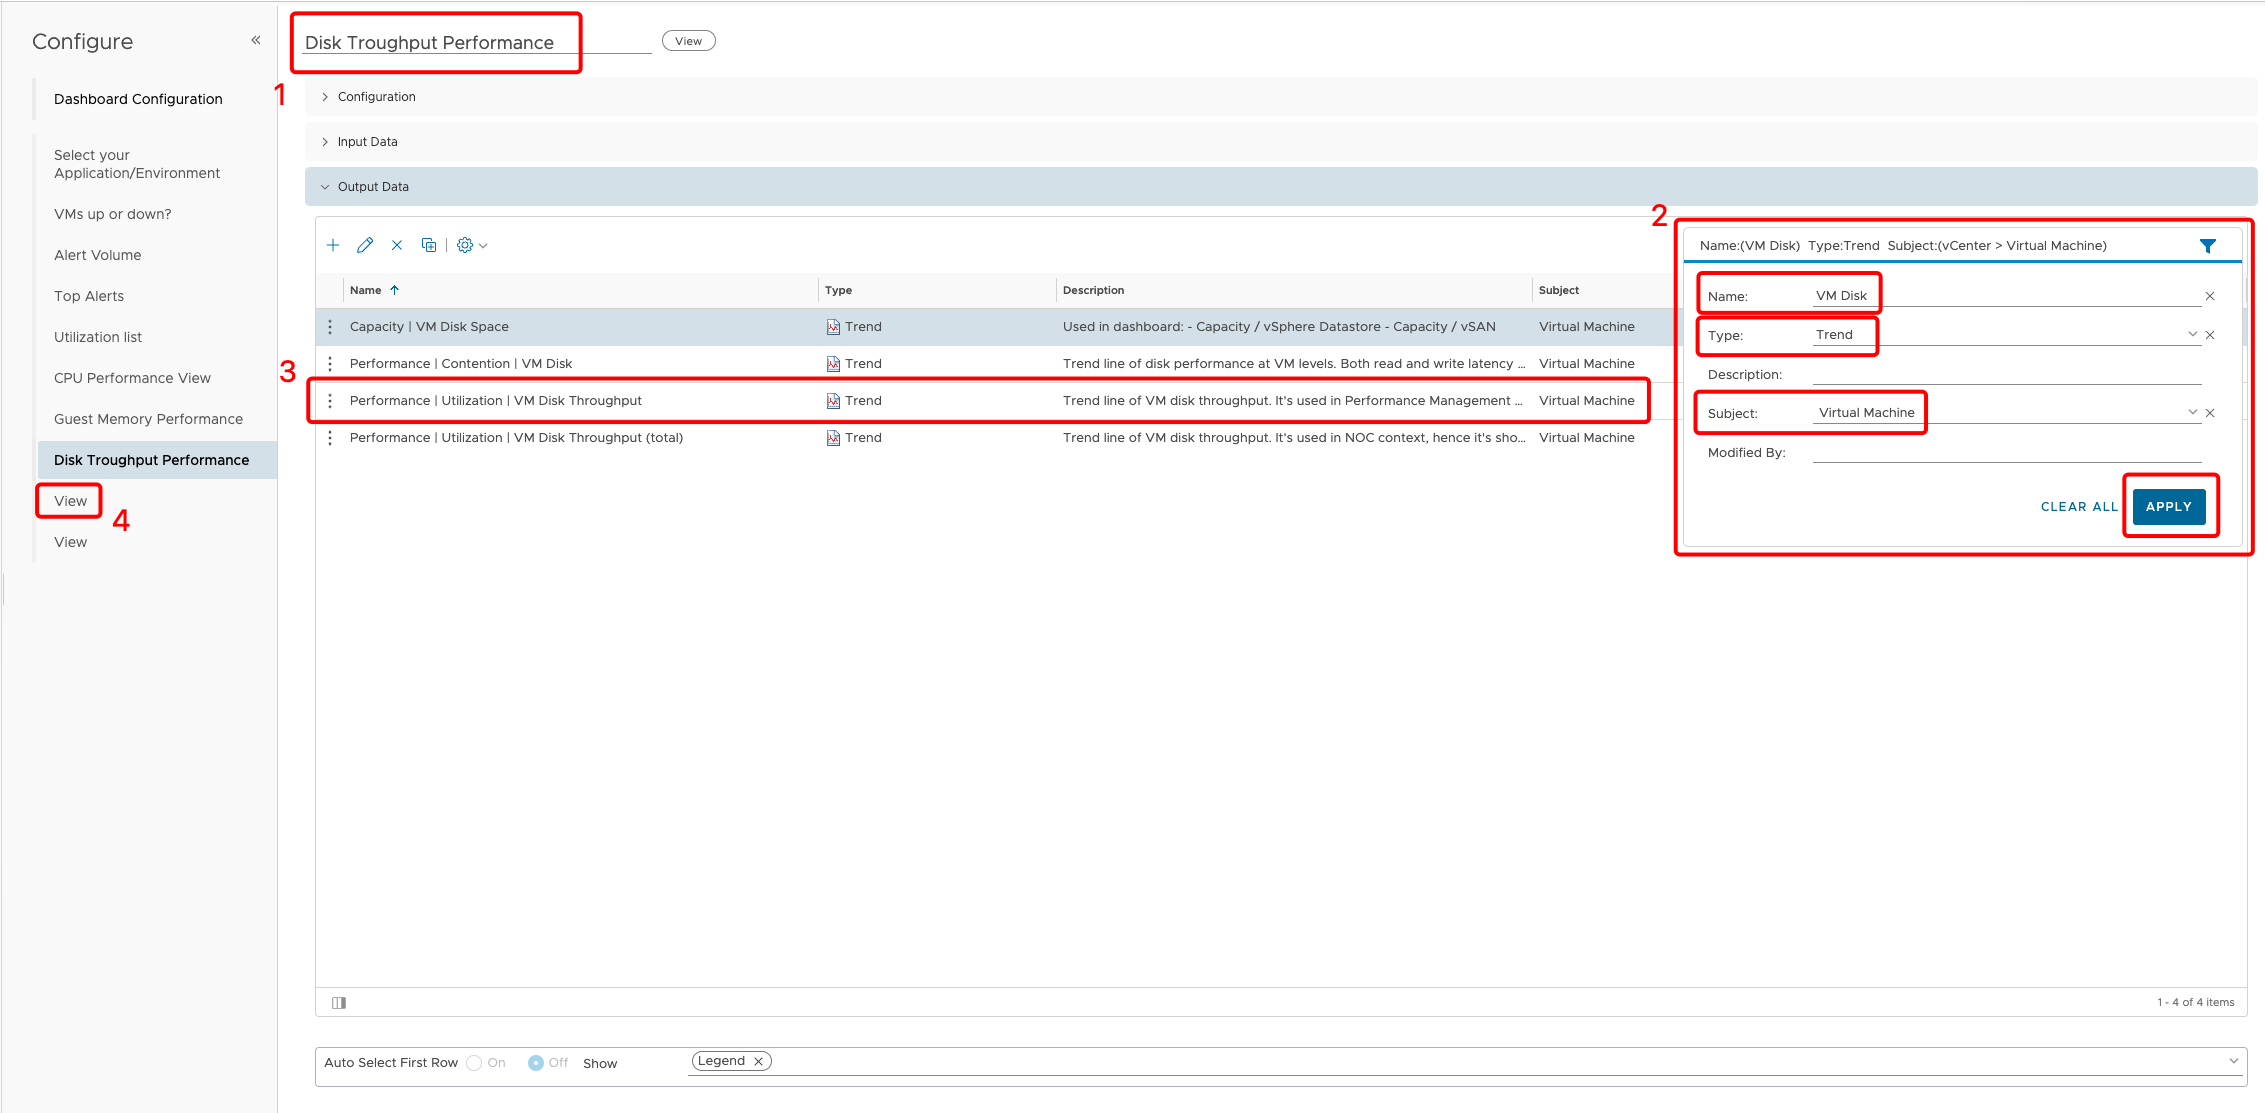
-
Change the name to “Disk Troughput Performance”.
-
Select funnel icon to use filter option:
- Name: VM Disk
- Type: Trend
- Subject: Virtual Machine
Click on APPLY.
-
Find and select **Performance Utilization VM Disk Troughput** view. - Click on View on the left panel to edit next widget.
Custom View widget
If the listed views do not provide required data, we can change existing view and amend it to desired state. We will practice this now.
- Drop a View widget.
- Click on Pencil icon to edit.
Disk view
Type a view Name FirstnameLastname ExpDay Disk and click NEXT.
-
Rename the view to Disk view.
-
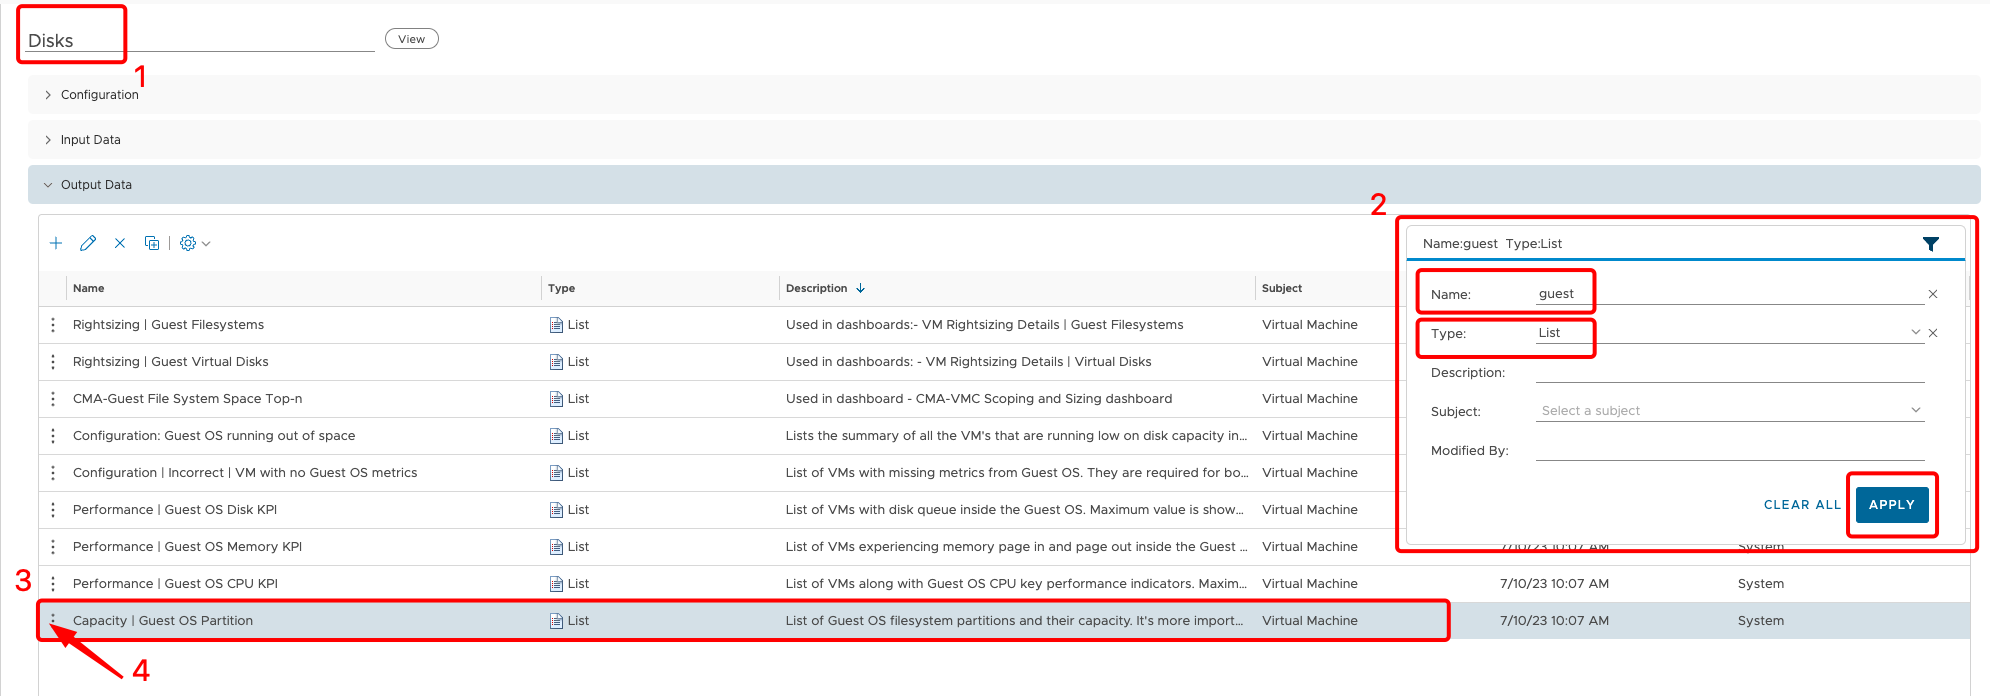
Select funnel icon to use filter option:
- Name: guest
- Type: List
Click on APPLY.
-
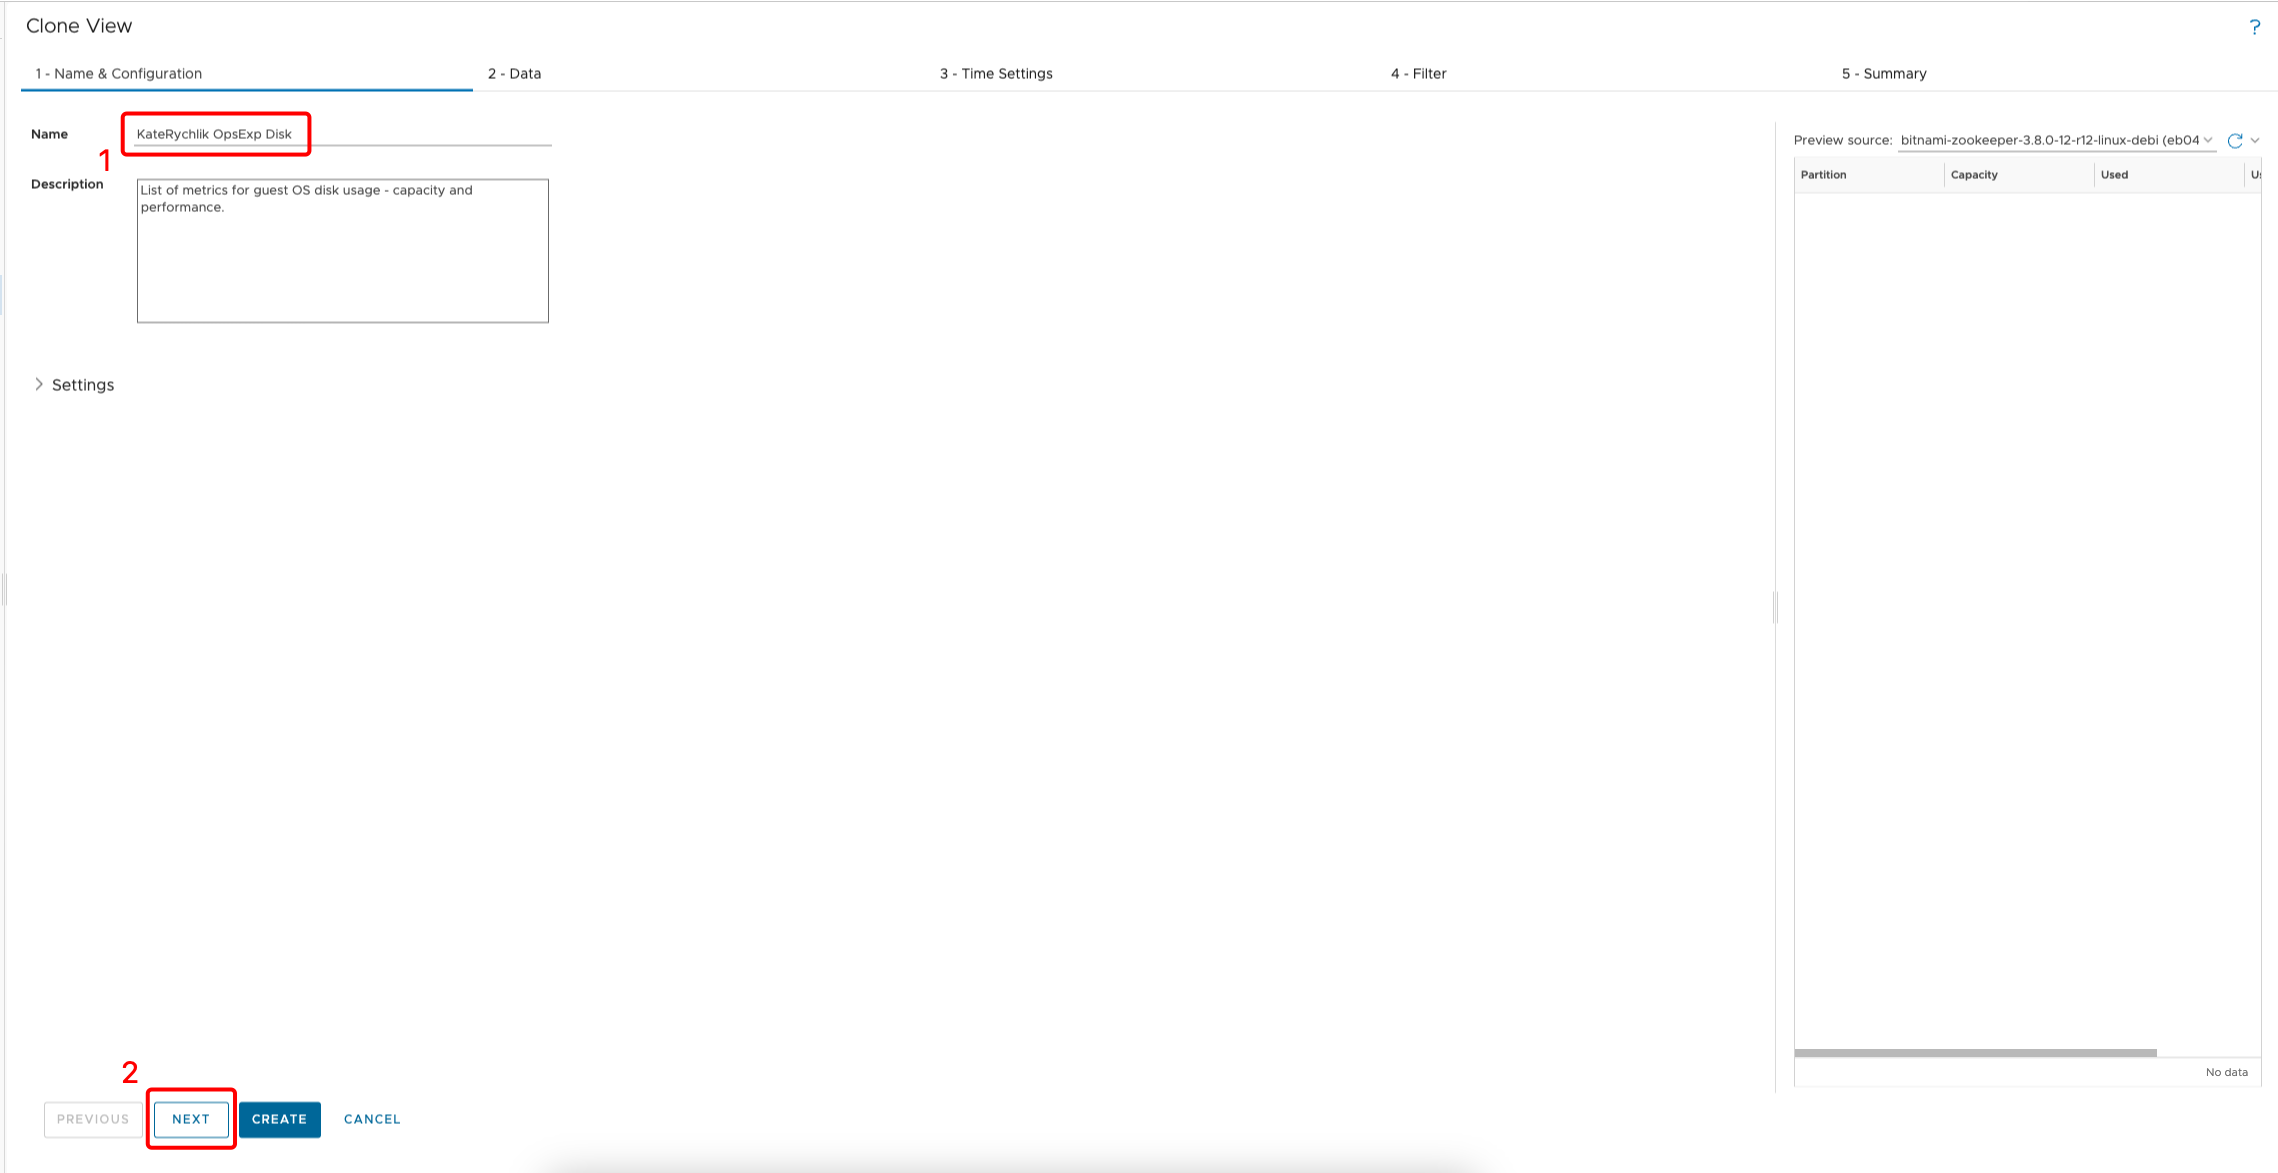
Select **Capacity Guest OS Partition**. - Click on … (dots) icon.
Select Clone.
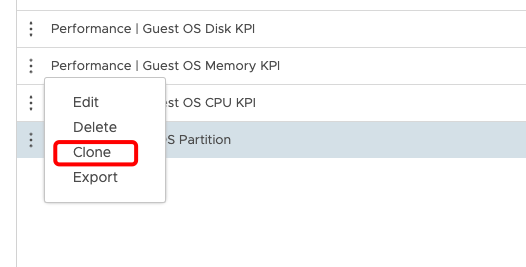
- Change the Name to FirstnameLastname OpsExp Disk.
- Click on NEXT.
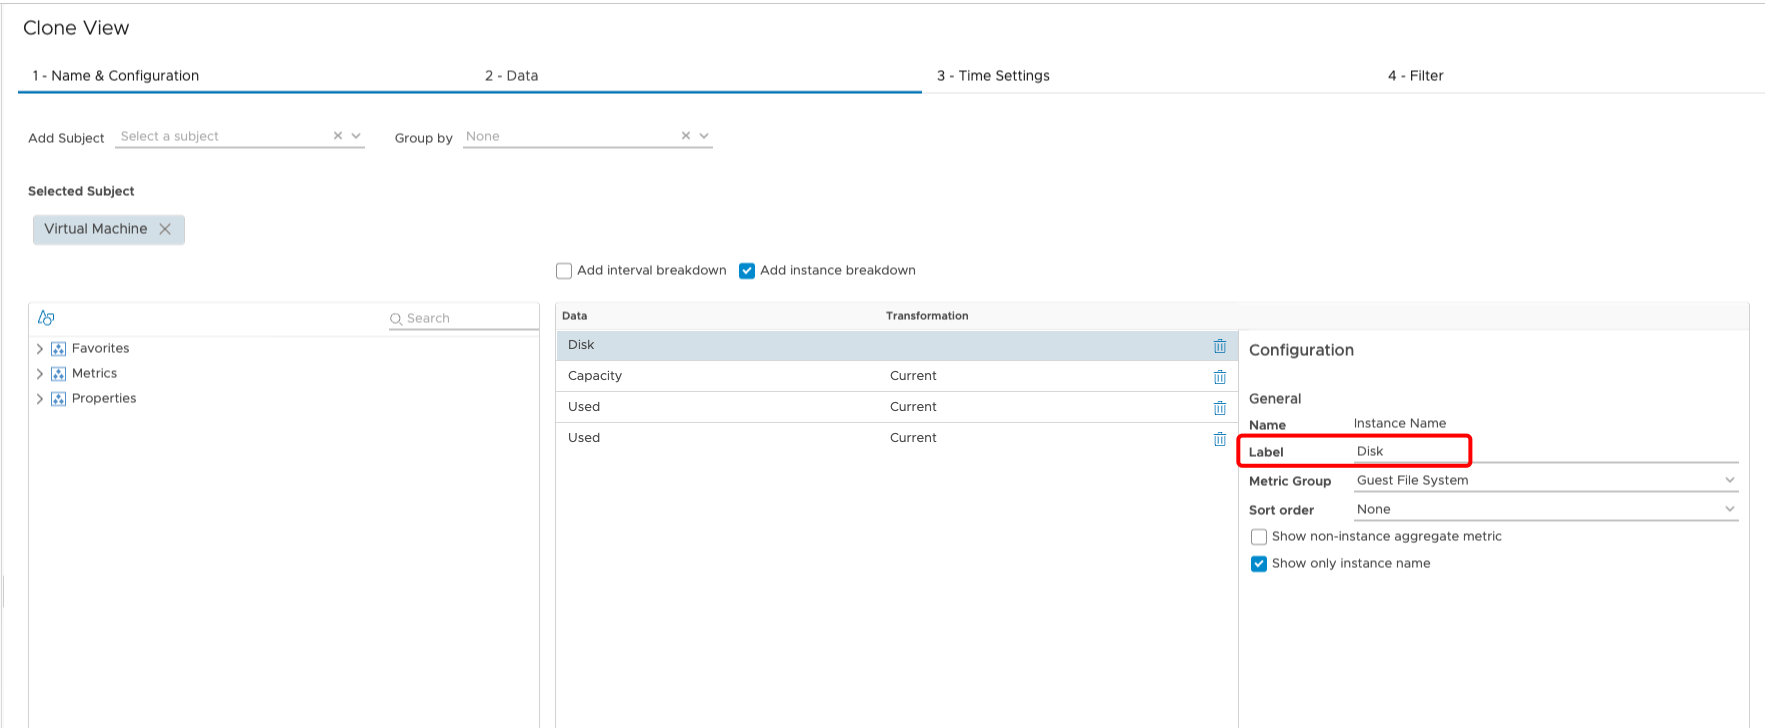
Rename the Partition Label to Disk.
Now we will be adding additional values to the view.
-
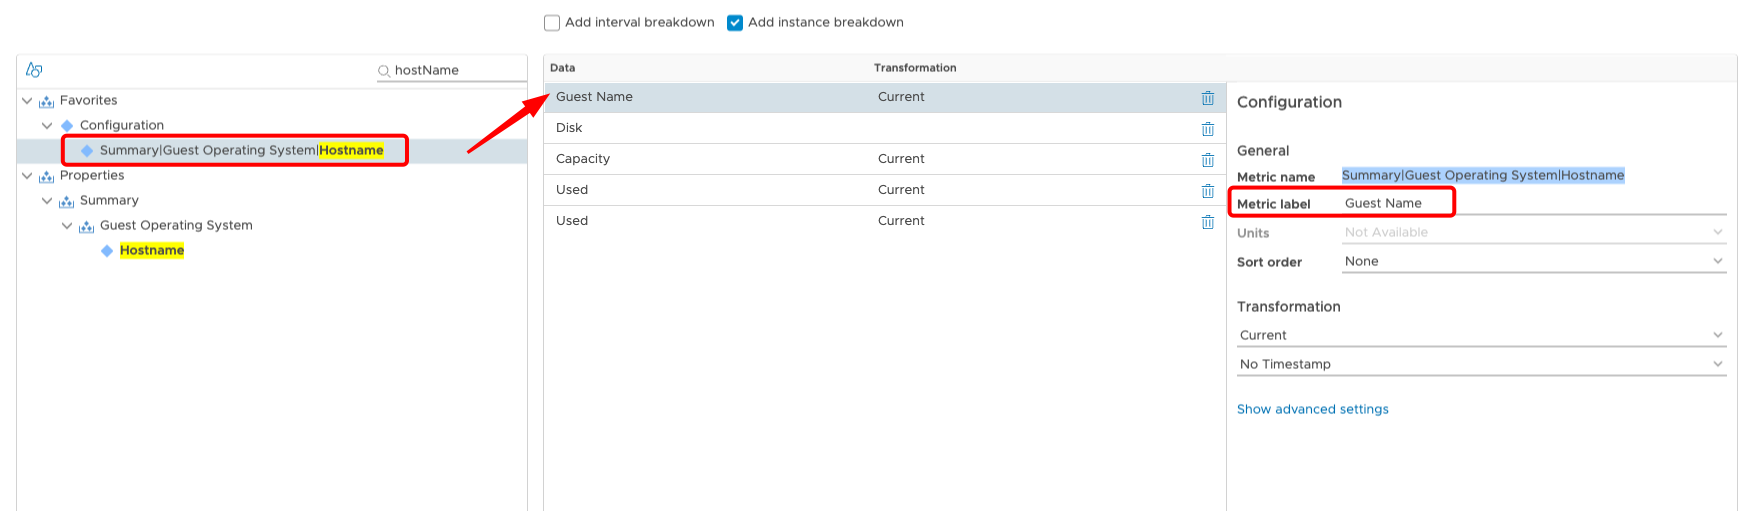
On the left menu use search field and type “hostName” to find **Summary Guest Operating System Hostname** metric. - Drag-and-drop it to middle column.
- Change Metric label to Guest Name.
-
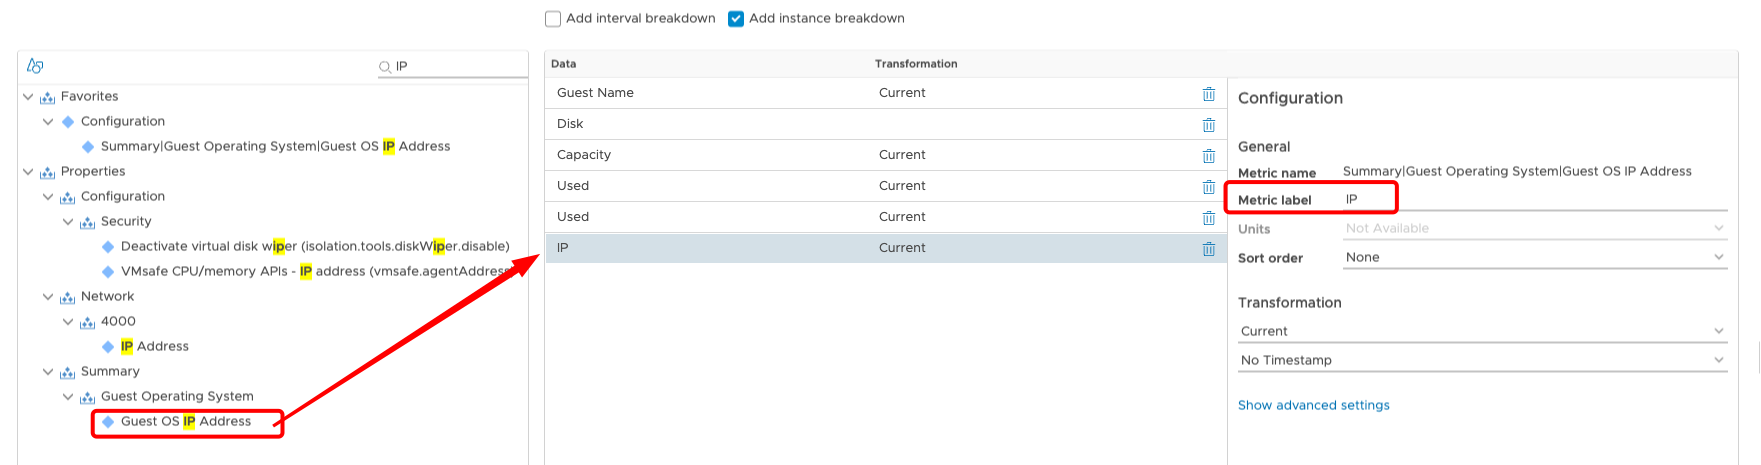
On the left menu use search field and type “IP” to find **Summary Guest Operating System Guest OS IP Address** metric. - Drag-and-drop it to middle column.
- Change Metric label to IP.
-
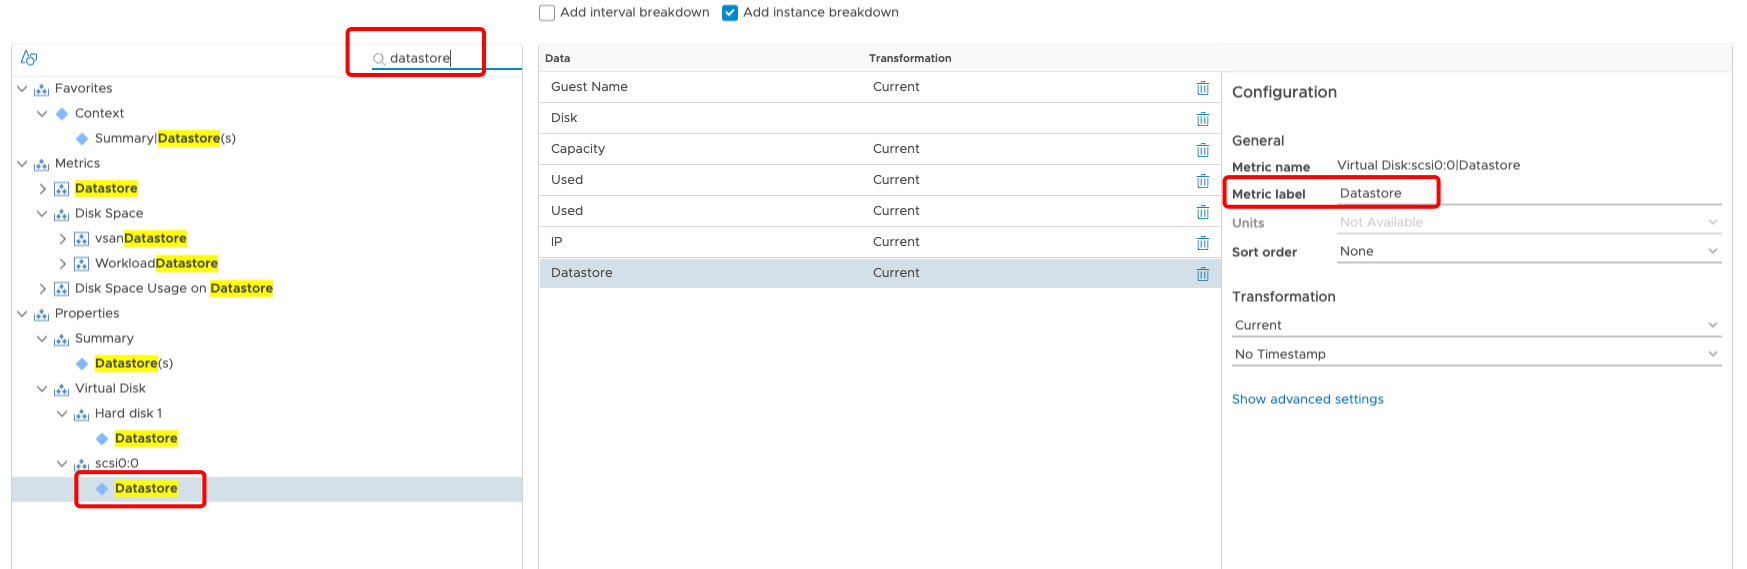
On the left menu use search field and type “Datastore” to find **Virtual Disk:scsi0:0 Datastore** metric. - Drag-and-drop it to middle column.
- Change Metric label to Datastore.
-
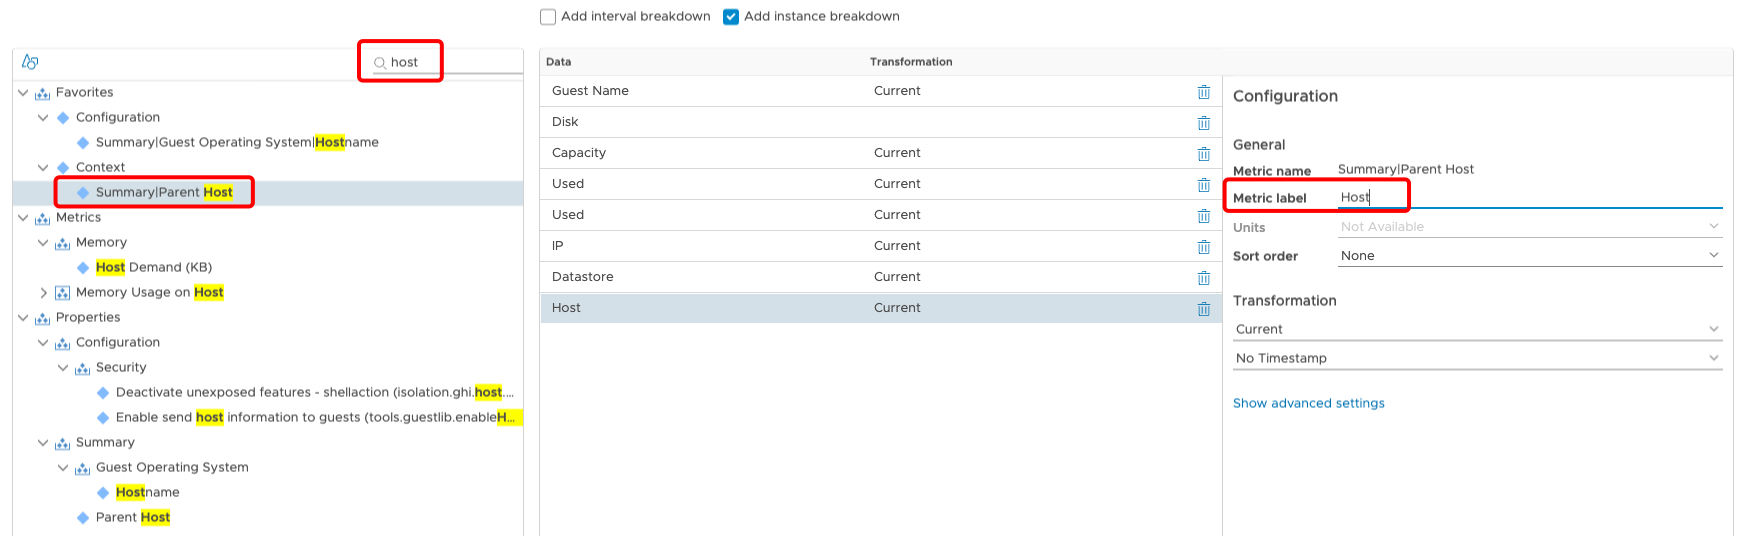
On the left menu use search field and type “host” to find **Summary Parent Host** metric. - Drag-and-drop it to middle column.
- Change Metric label to Host.
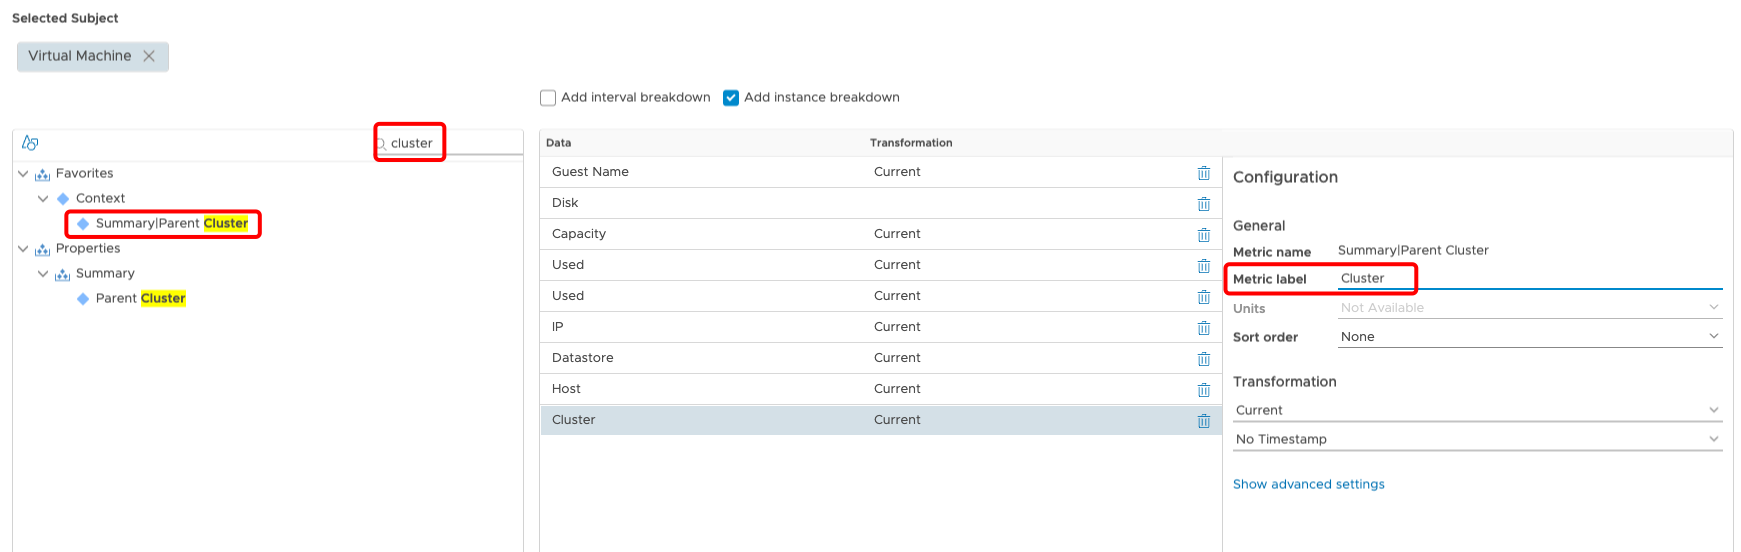
-
On the left menu use search field and type “cluster” to find **Summary Parent Cluster** metric. - Drag-and-drop it to middle column.
- Change Metric label to Cluster.
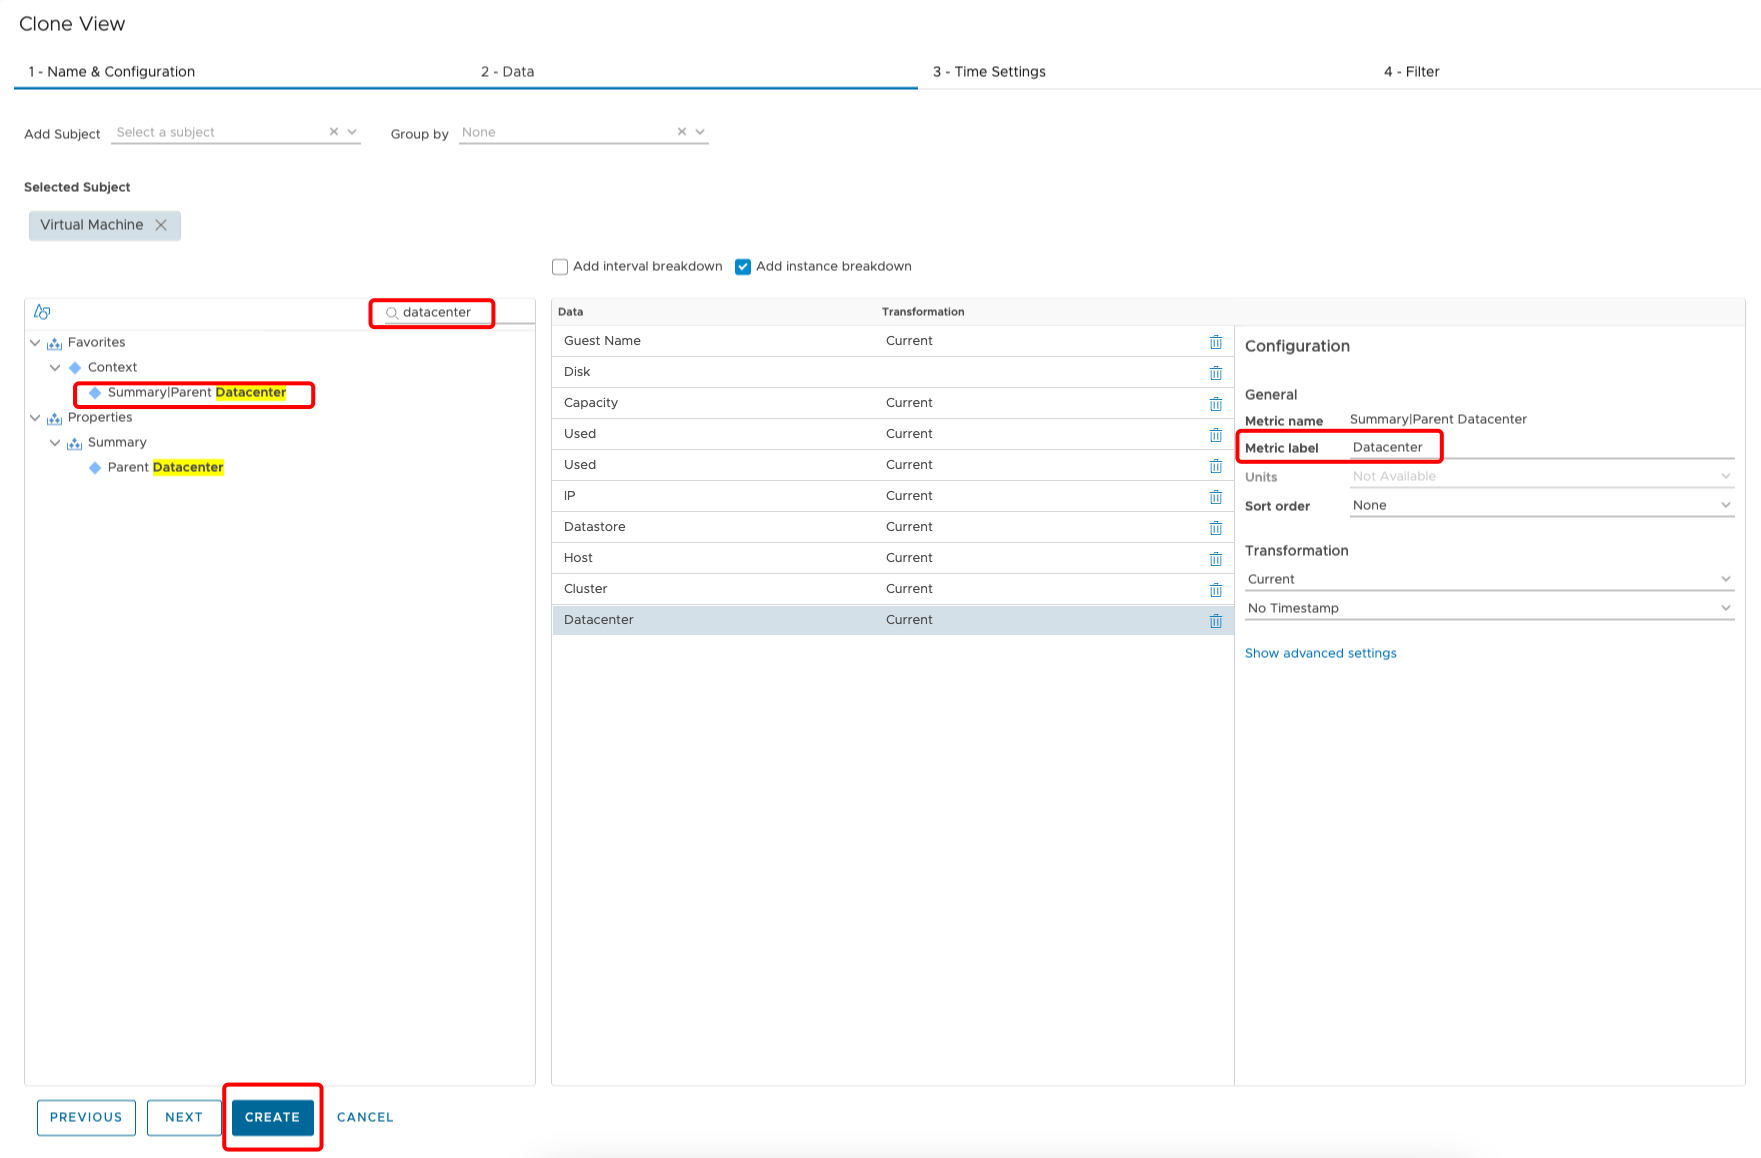
-
On the left menu use search field and type “datacenter” to find **Summary Parent Datacenter** metric. - Drag-and-drop it to middle column.
- Change Metric label to Datacenter.
- Click on CREATE.
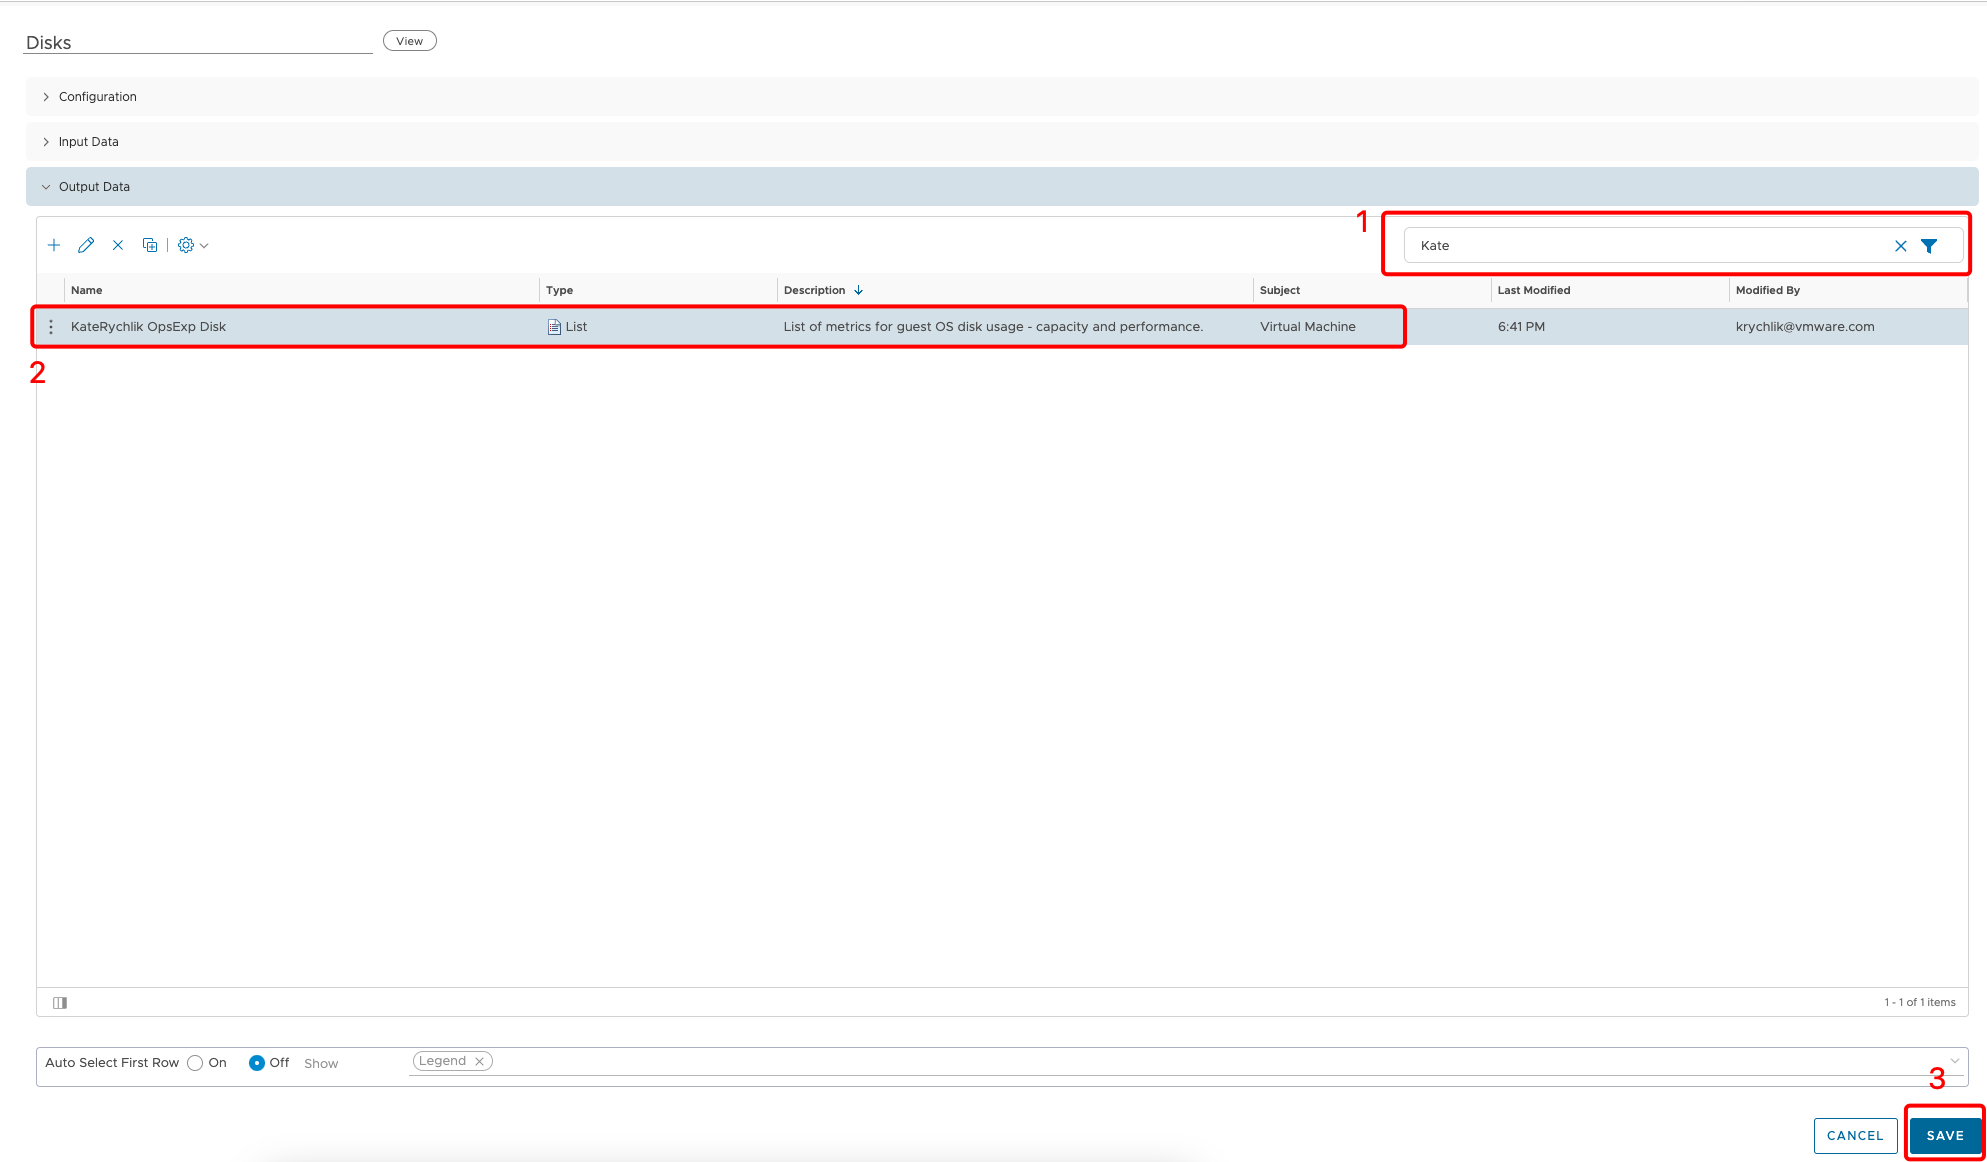
- Clear filer and type your FirstName.
- Select the newly created view.
- Click on SAVE.
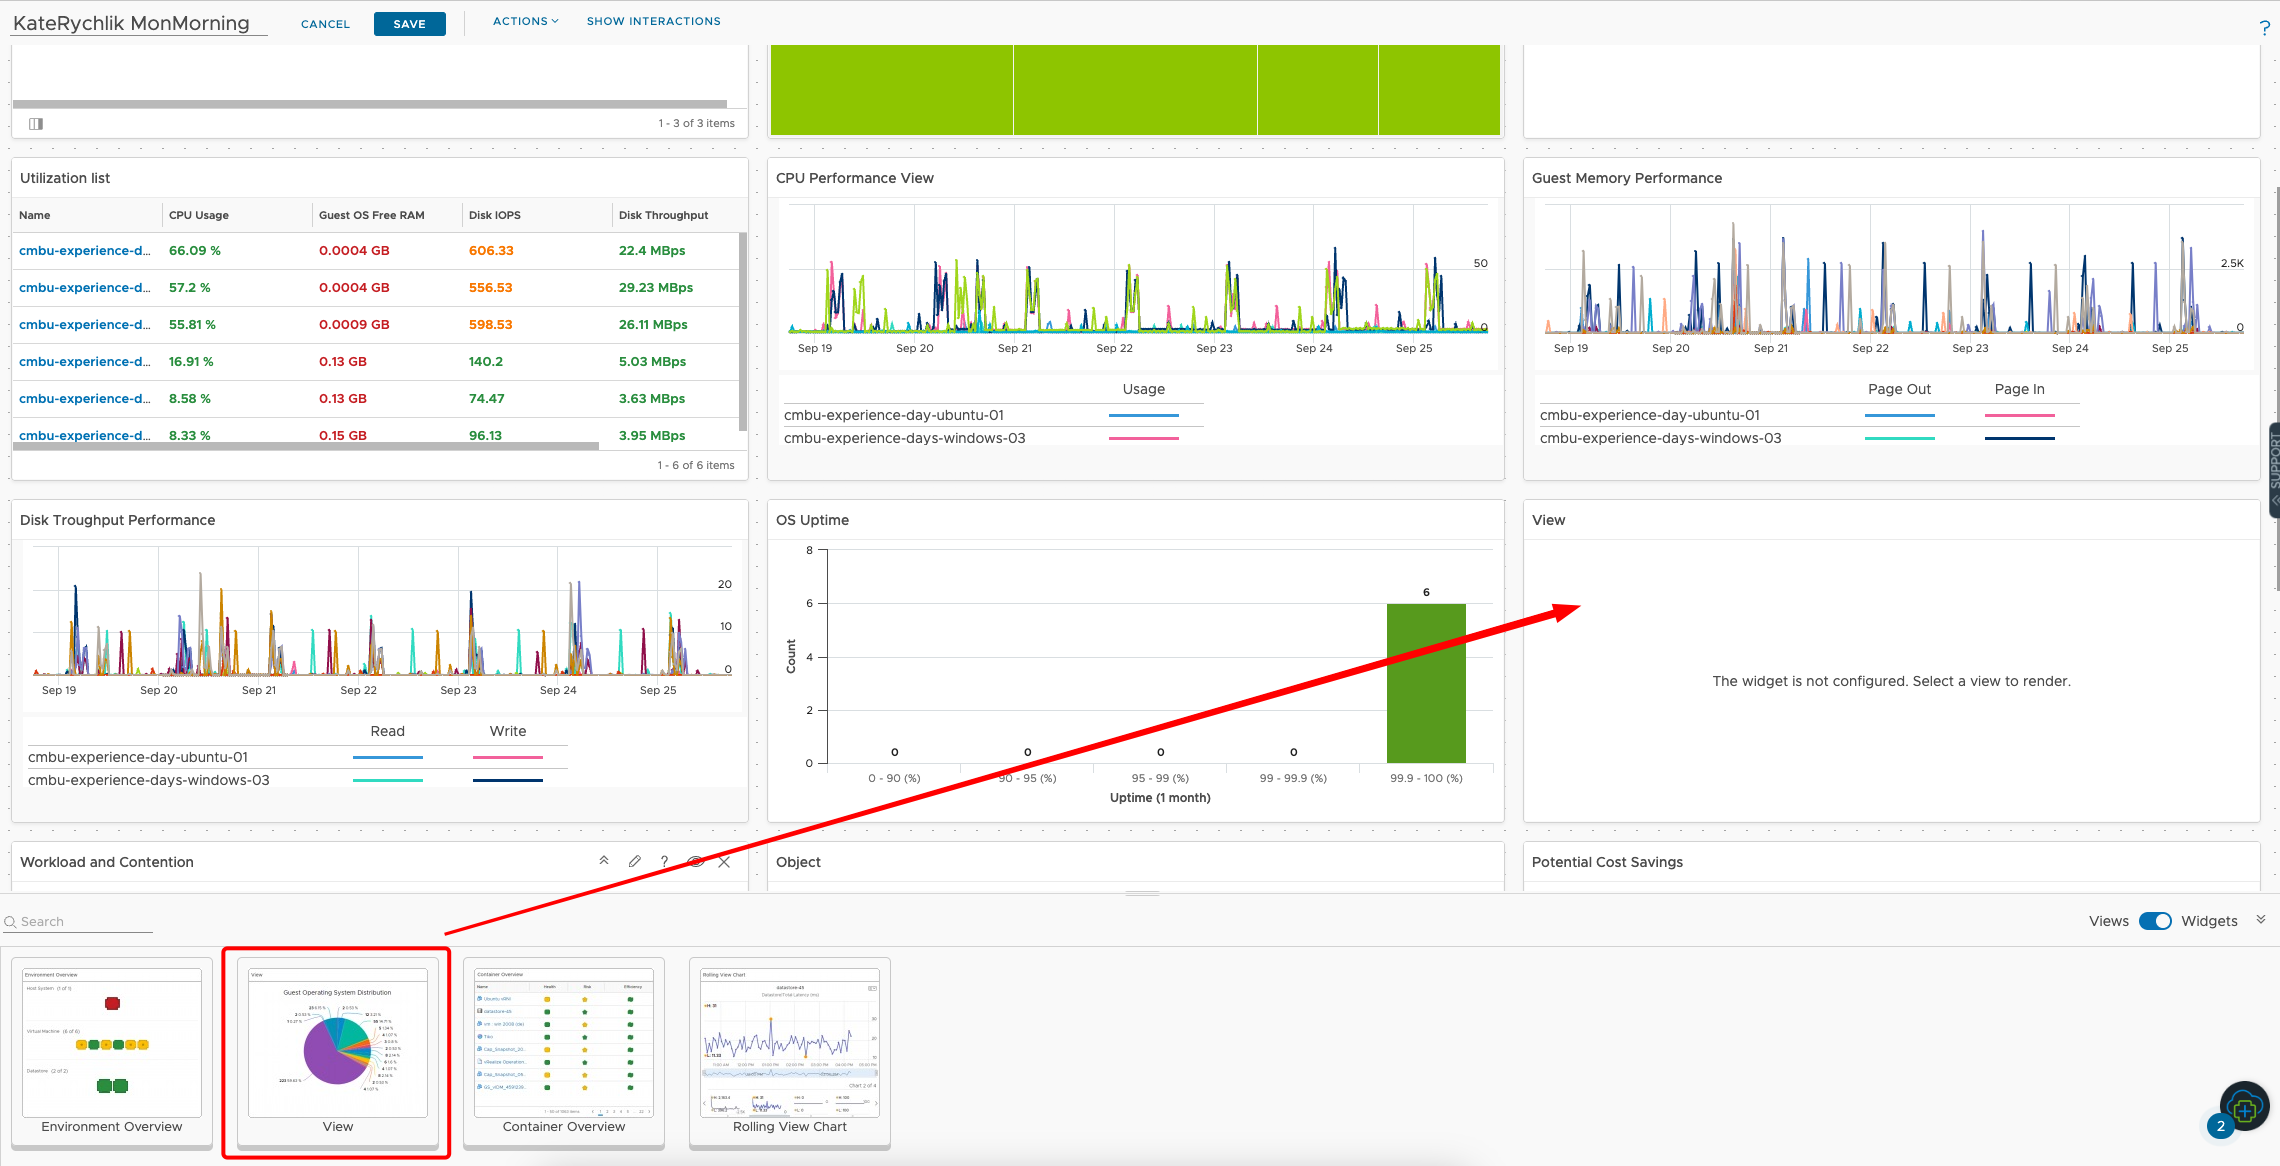
OS Uptime
-
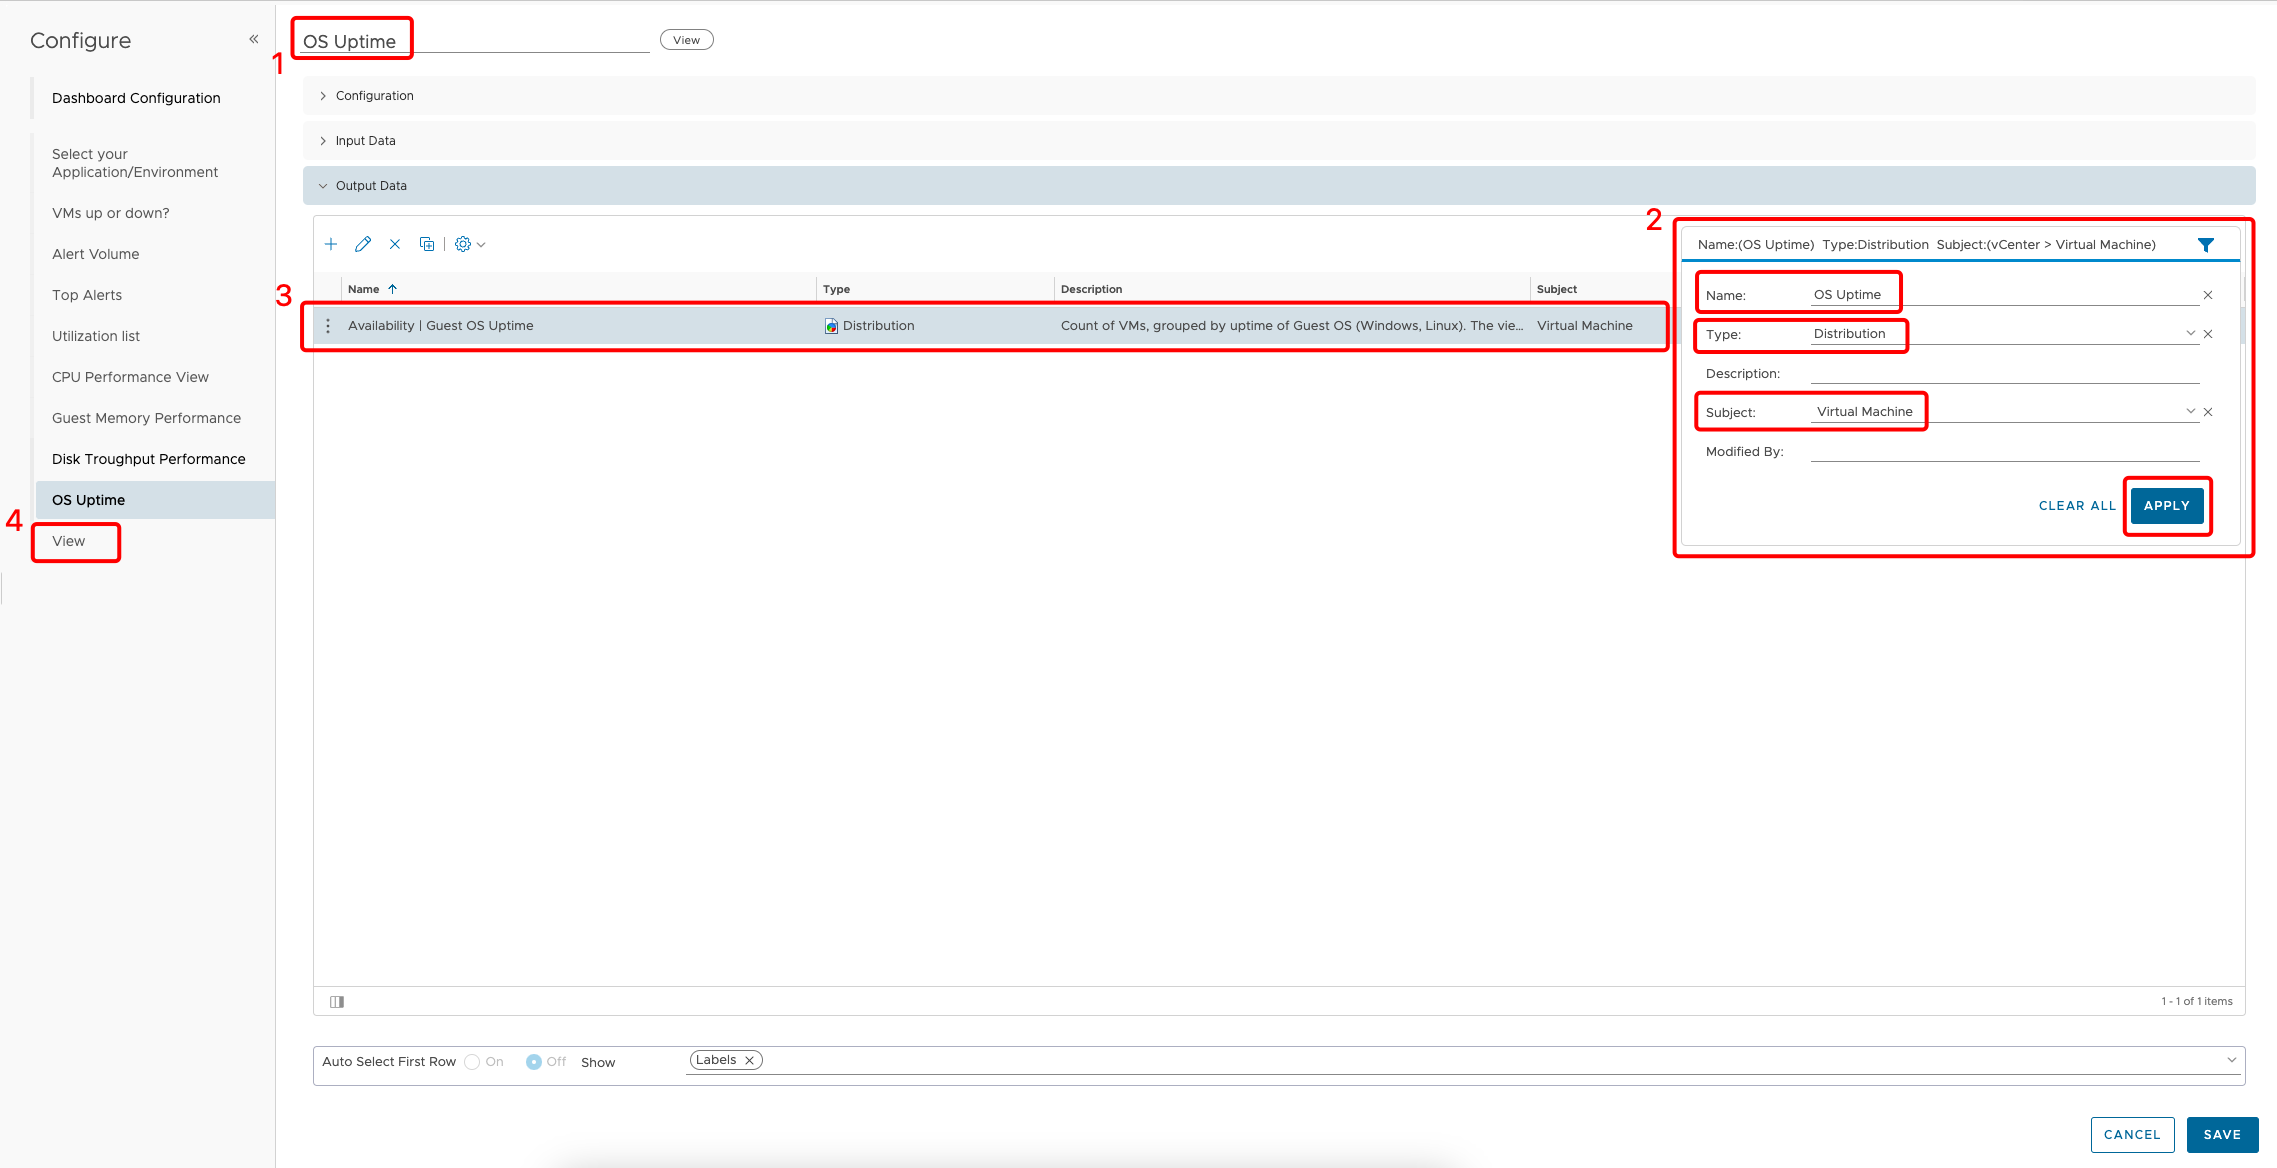
Change the name to “OS Uptime”.
-
Select funnel icon to use filter option:
- Name: OS Uptime
- Type: Distribution
- Subject: Virtual Machine
Click on APPLY.
-
Find and select **Availability Guest OS Uptime** view. - Click on View on the left panel to edit next widget.
Potential Cost Saving
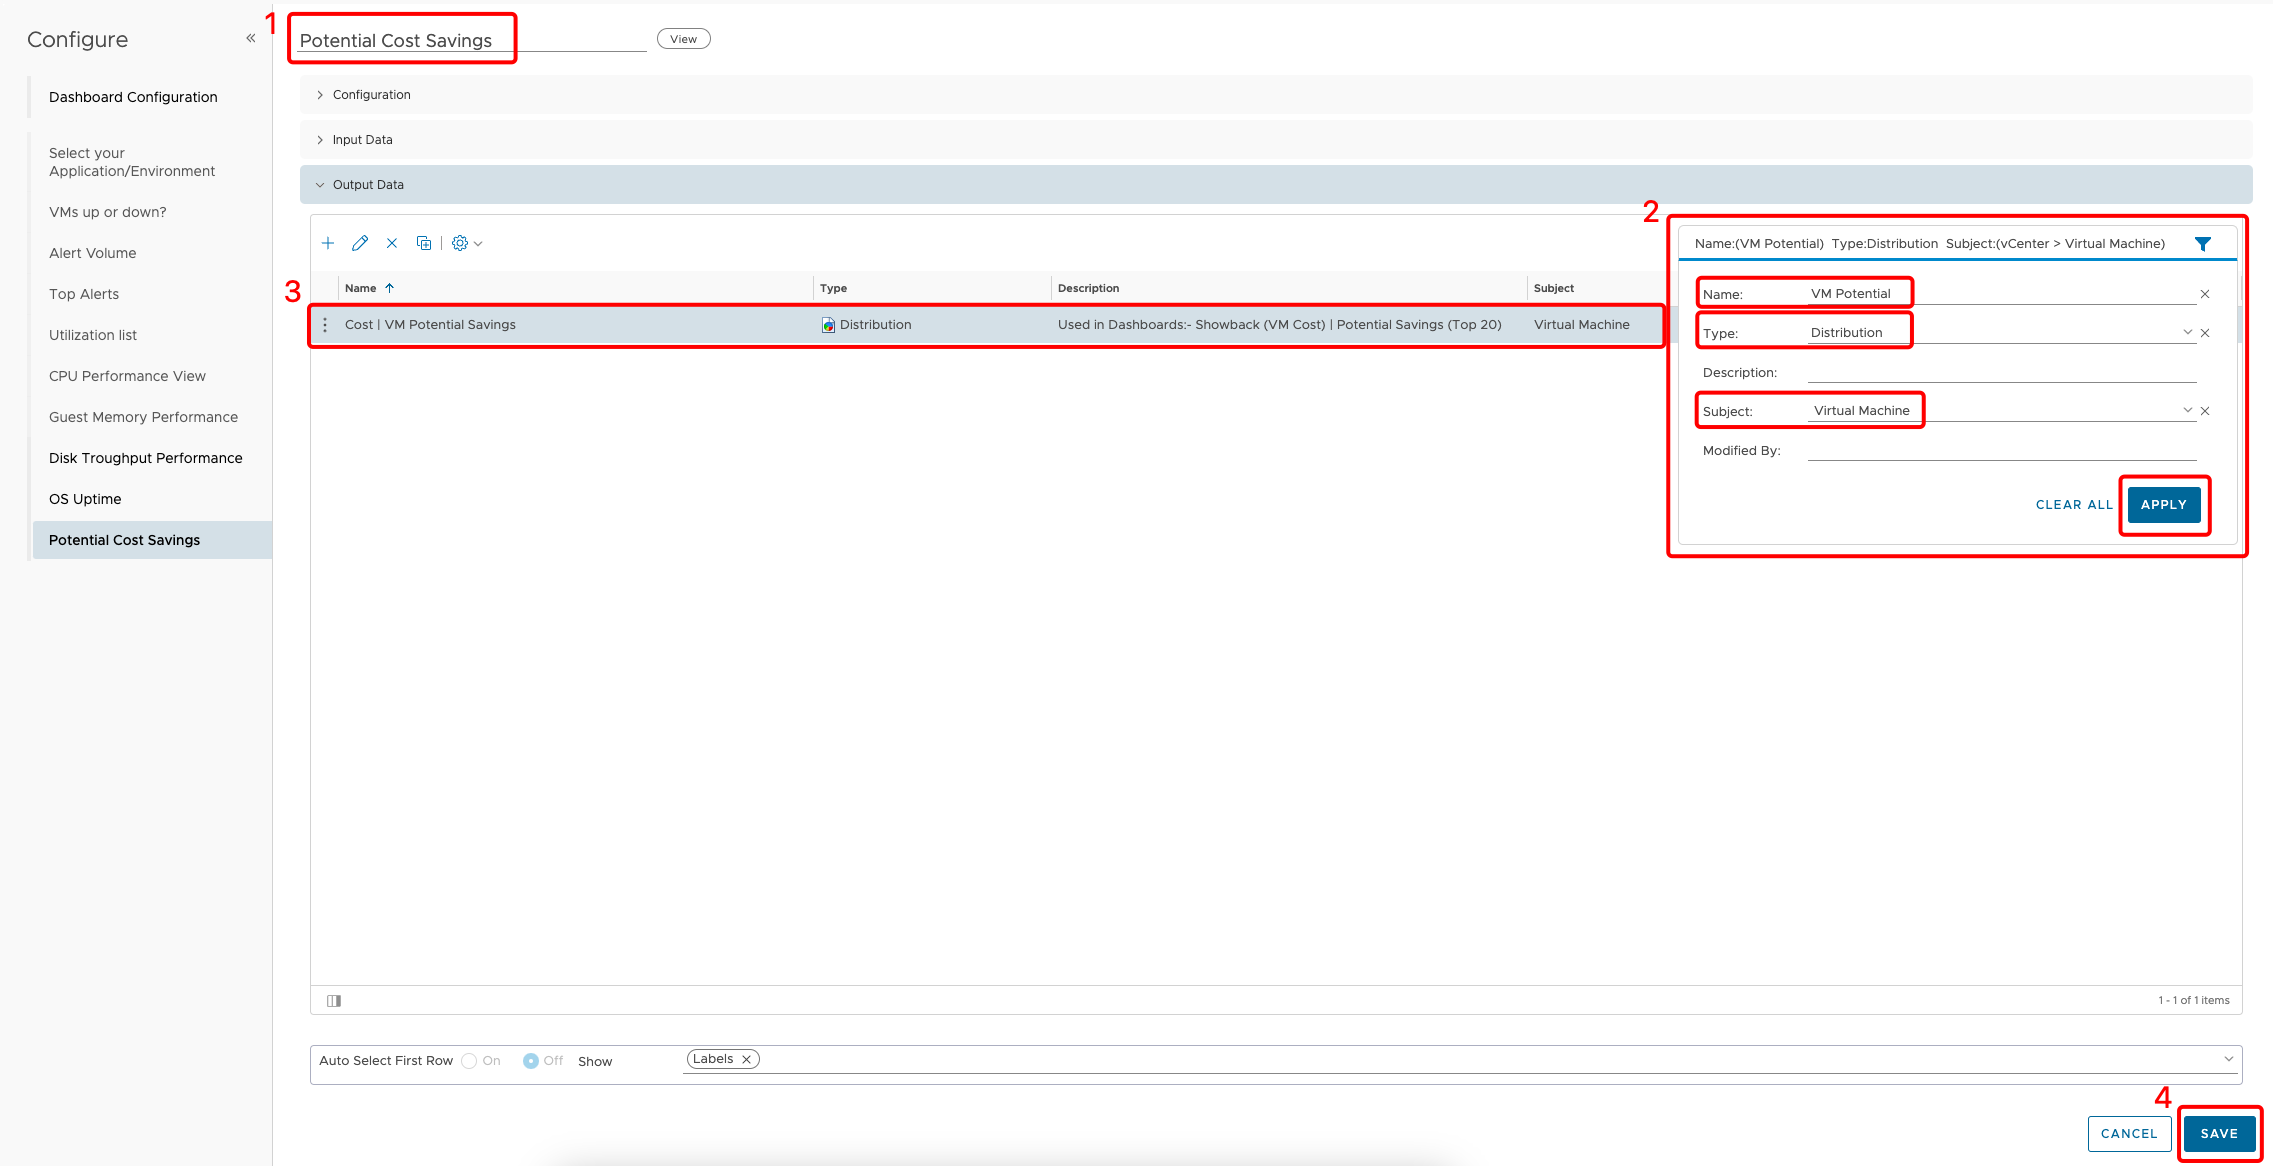
-
Change the name to “Potential Cost Savings”.
-
Select funnel icon to use filter option:
- Name: VM Potential
- Type: Distribution
- Subject: Virtual Machine
Click on APPLY.
-
Find and select **Cost VM Potential Savings** view. - Click on SAVE.
Workload and Contention
- Dropdown Heatmap widget to canvas.
- Click on pencil icon to edit.
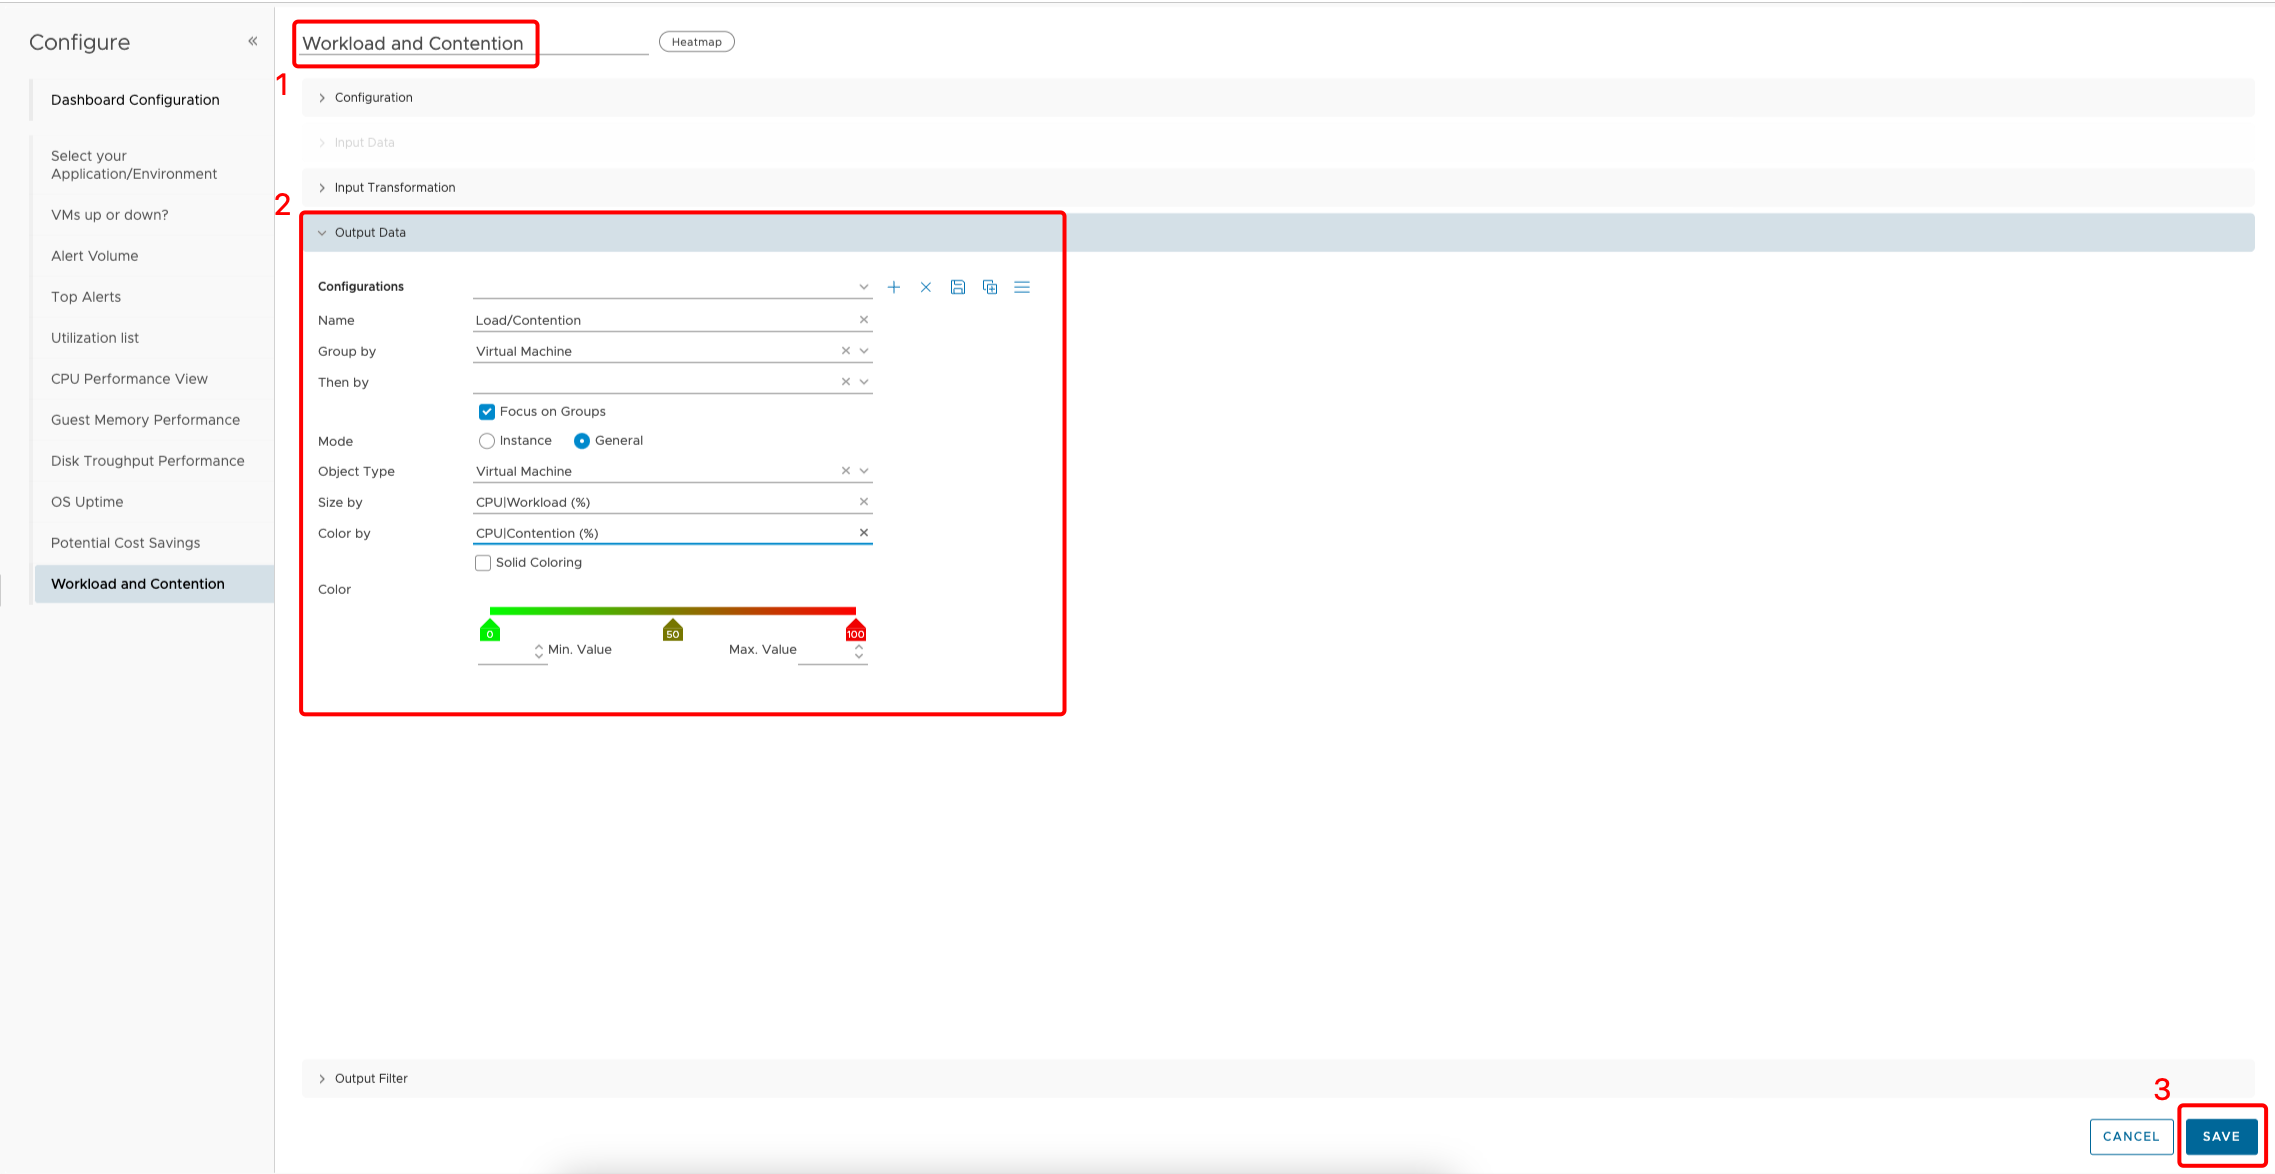
- Rename to “VMs up or down?”.
- Click on >Output Data and provide values:
- Name: Load/Contention
- Group by Virtual Machine.
- Check Focus on Groups.
- Object Type Virtual Machine.
-
Size by in search field type: **CPU Workload(%)** -
Color by in search field type: **CPU Contention(%)**
- Click SAVE.
Object Relationship
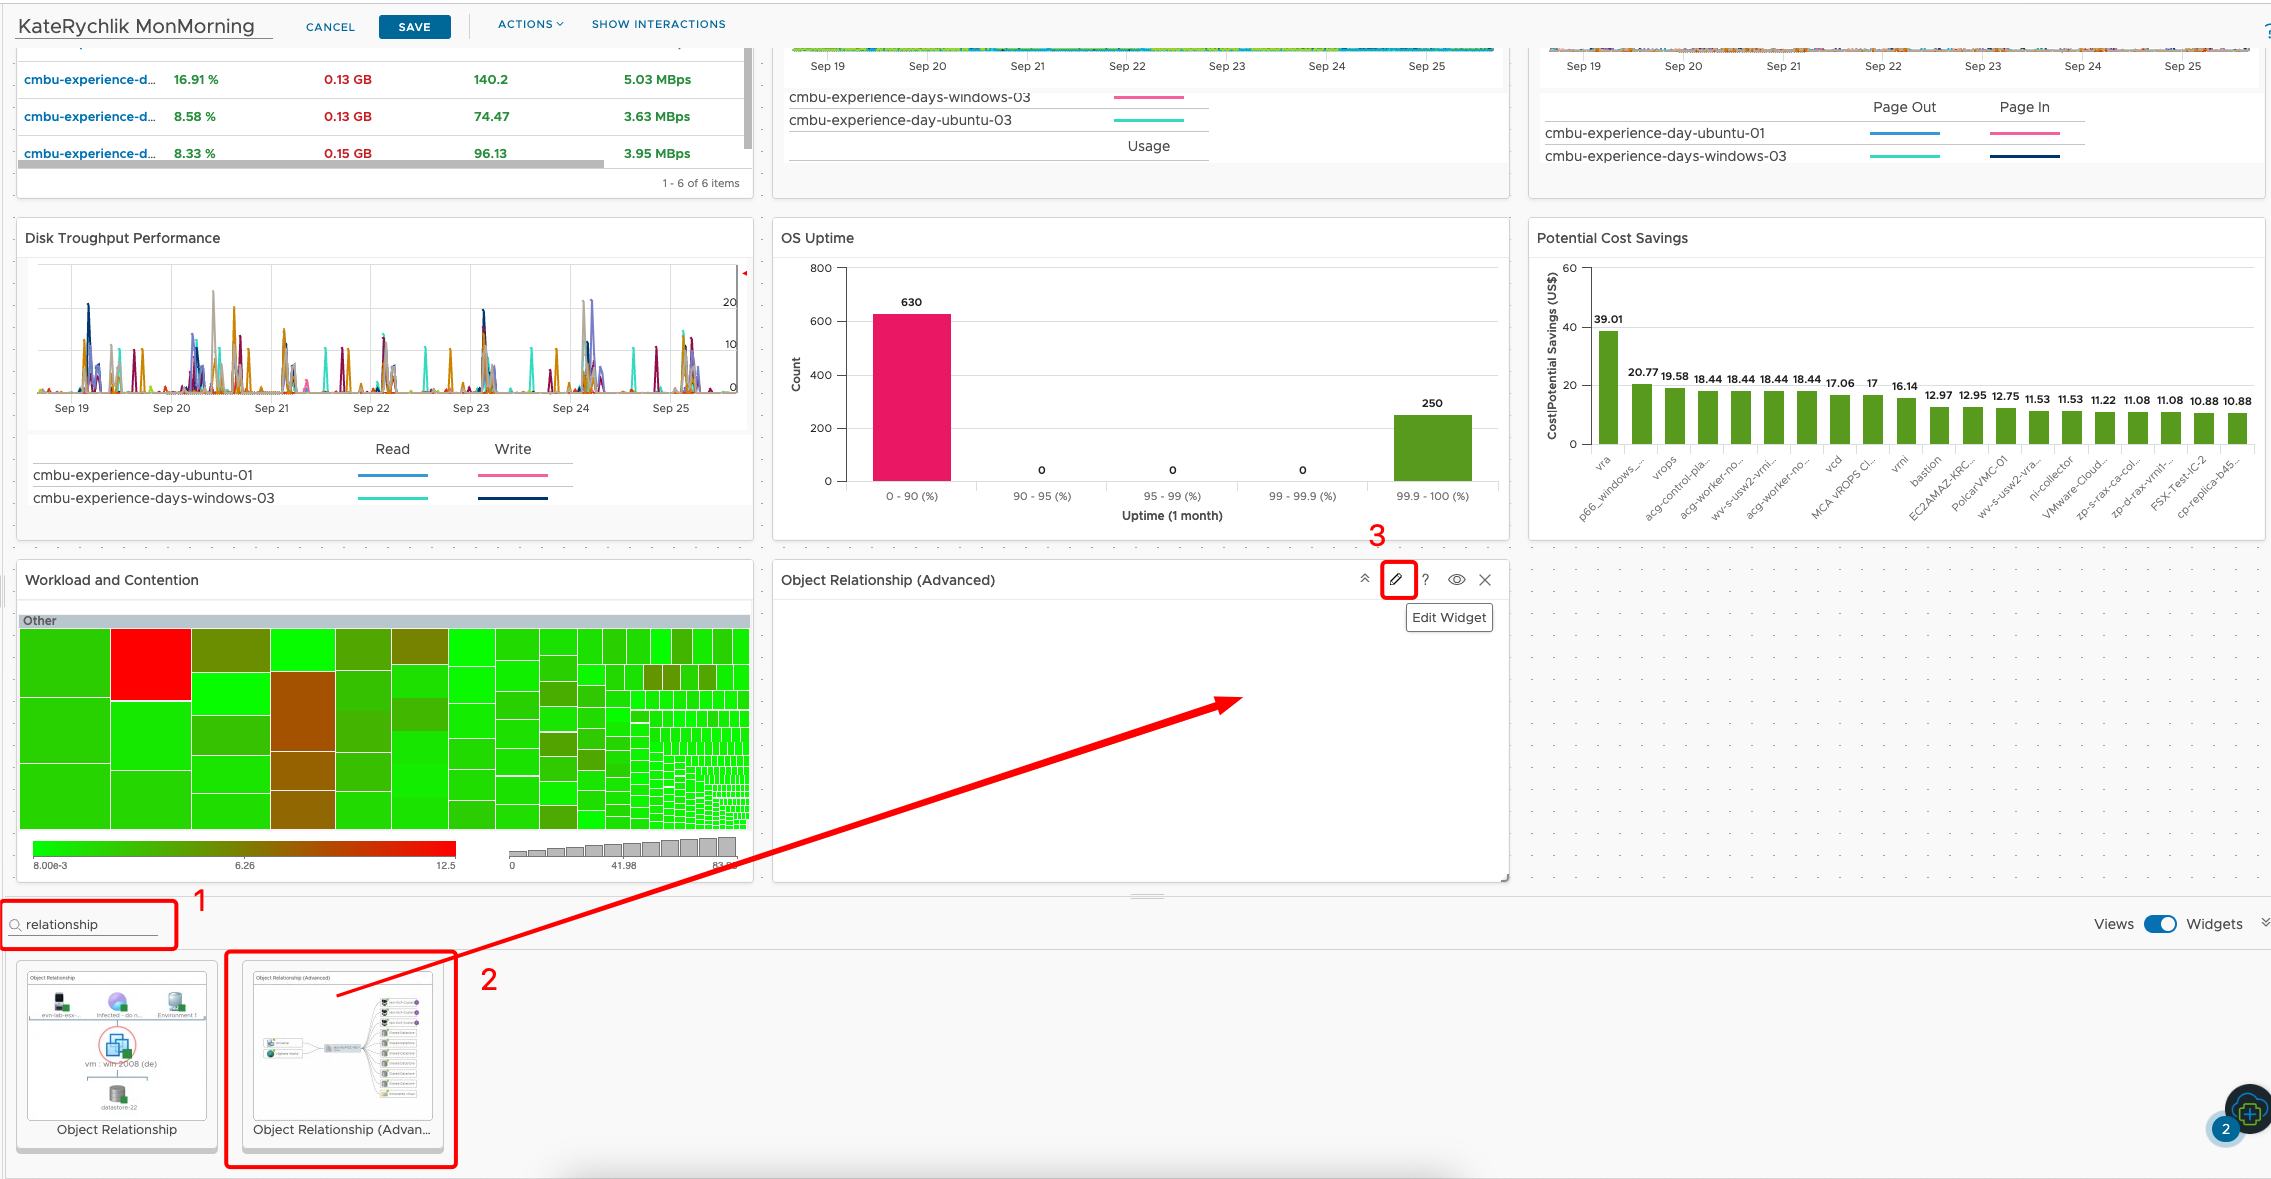
- Find Object Relationship (Advanced) widget by typing in widget search field “relationship”.
- Drop Object Relationship (Advanced) widget on canvas.
- Click on Pencil icon to edit.
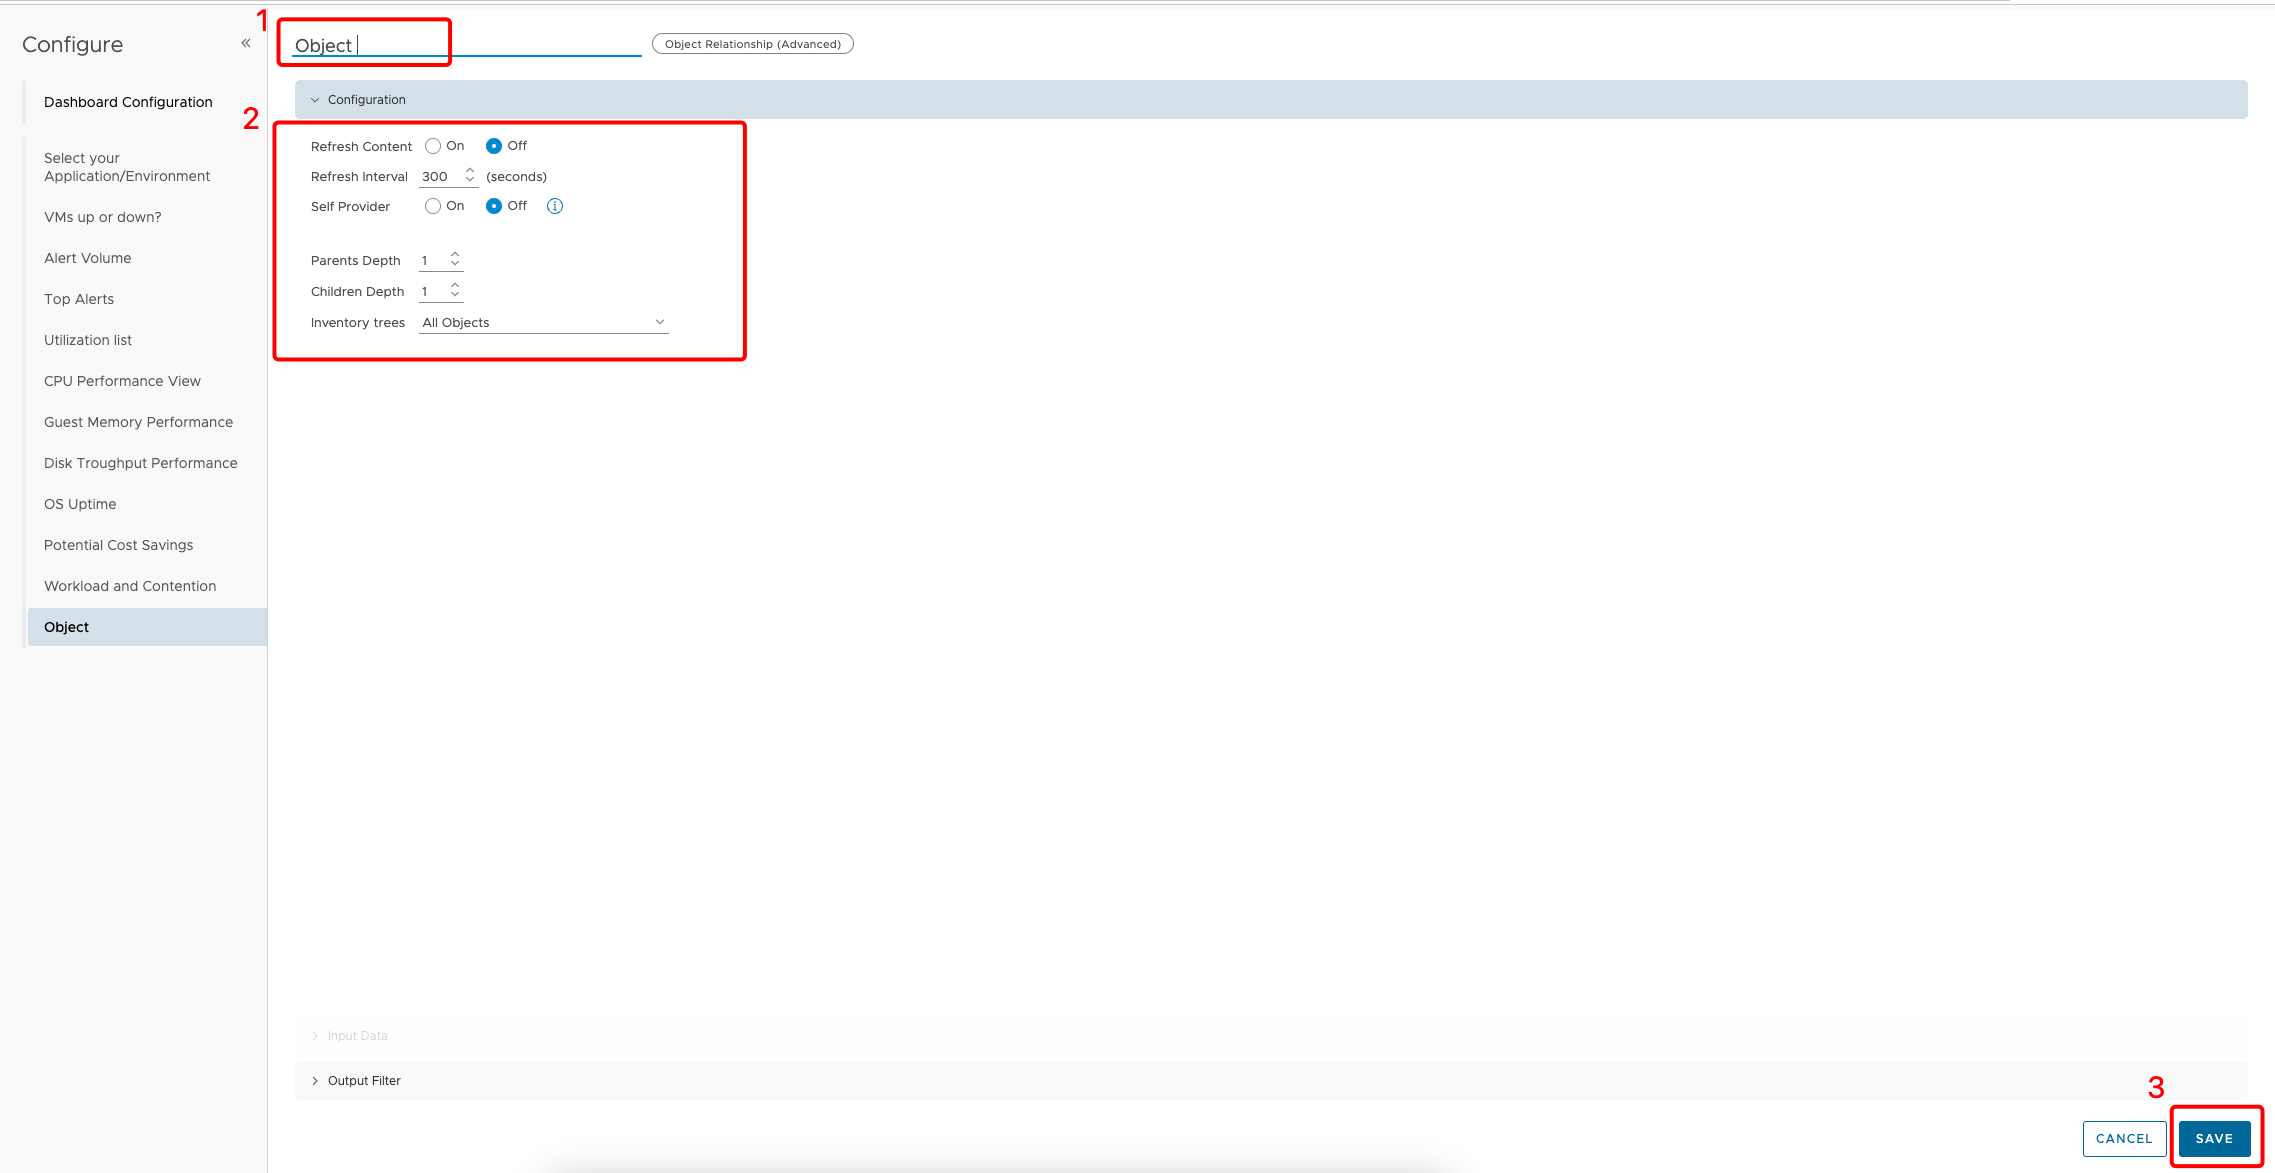
- Rename to Object.
- Leave the default values.
- Click SAVE.
Topology Graph
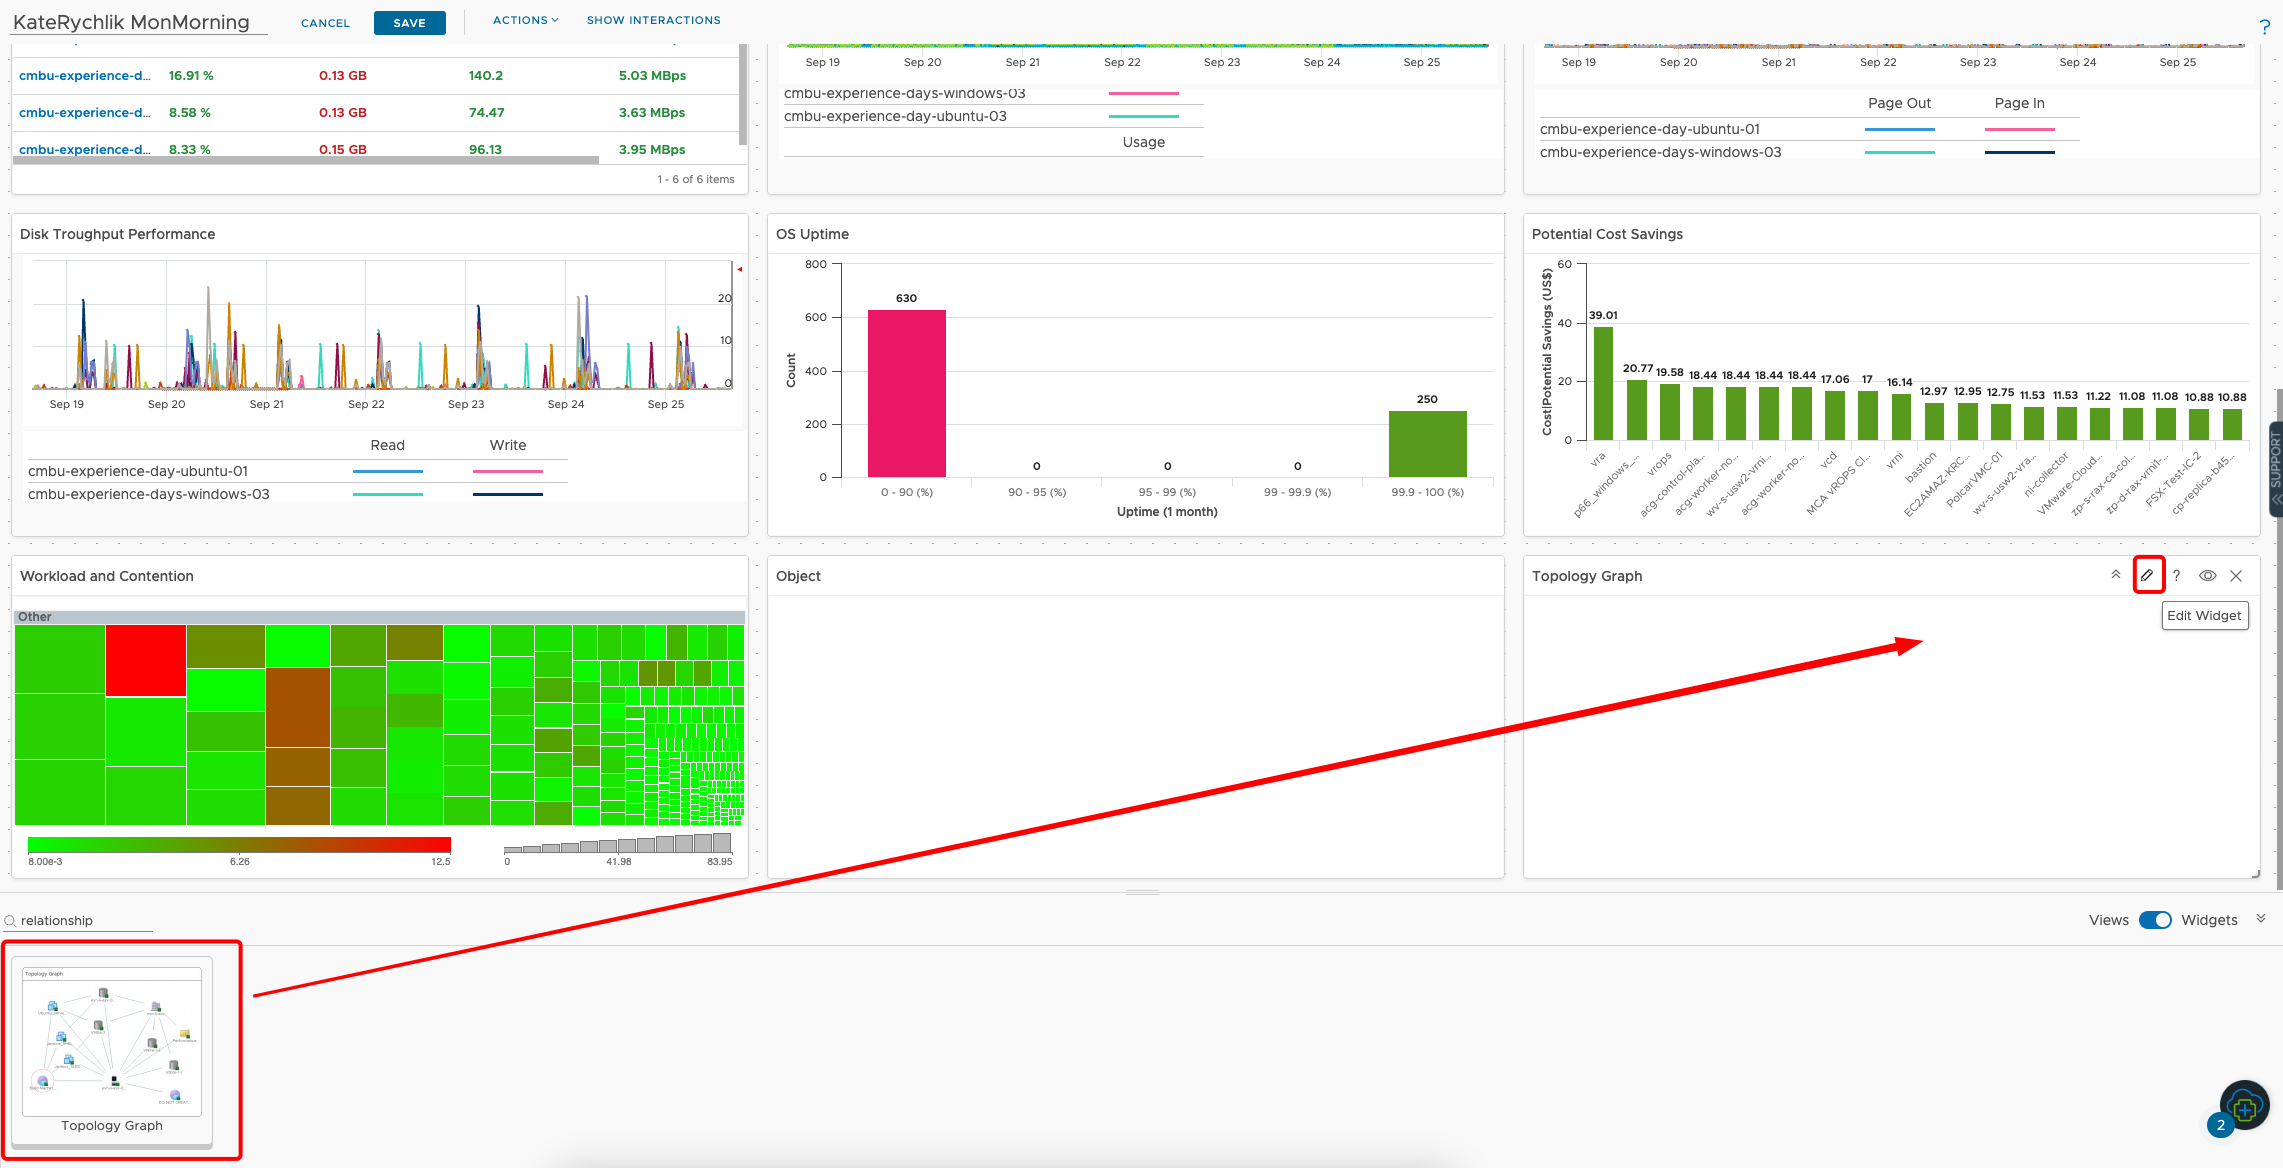
- Find Topology Graph widget.
- Drop Topology Graph widget on canvas.
- Click Pencil icon to edit widget.
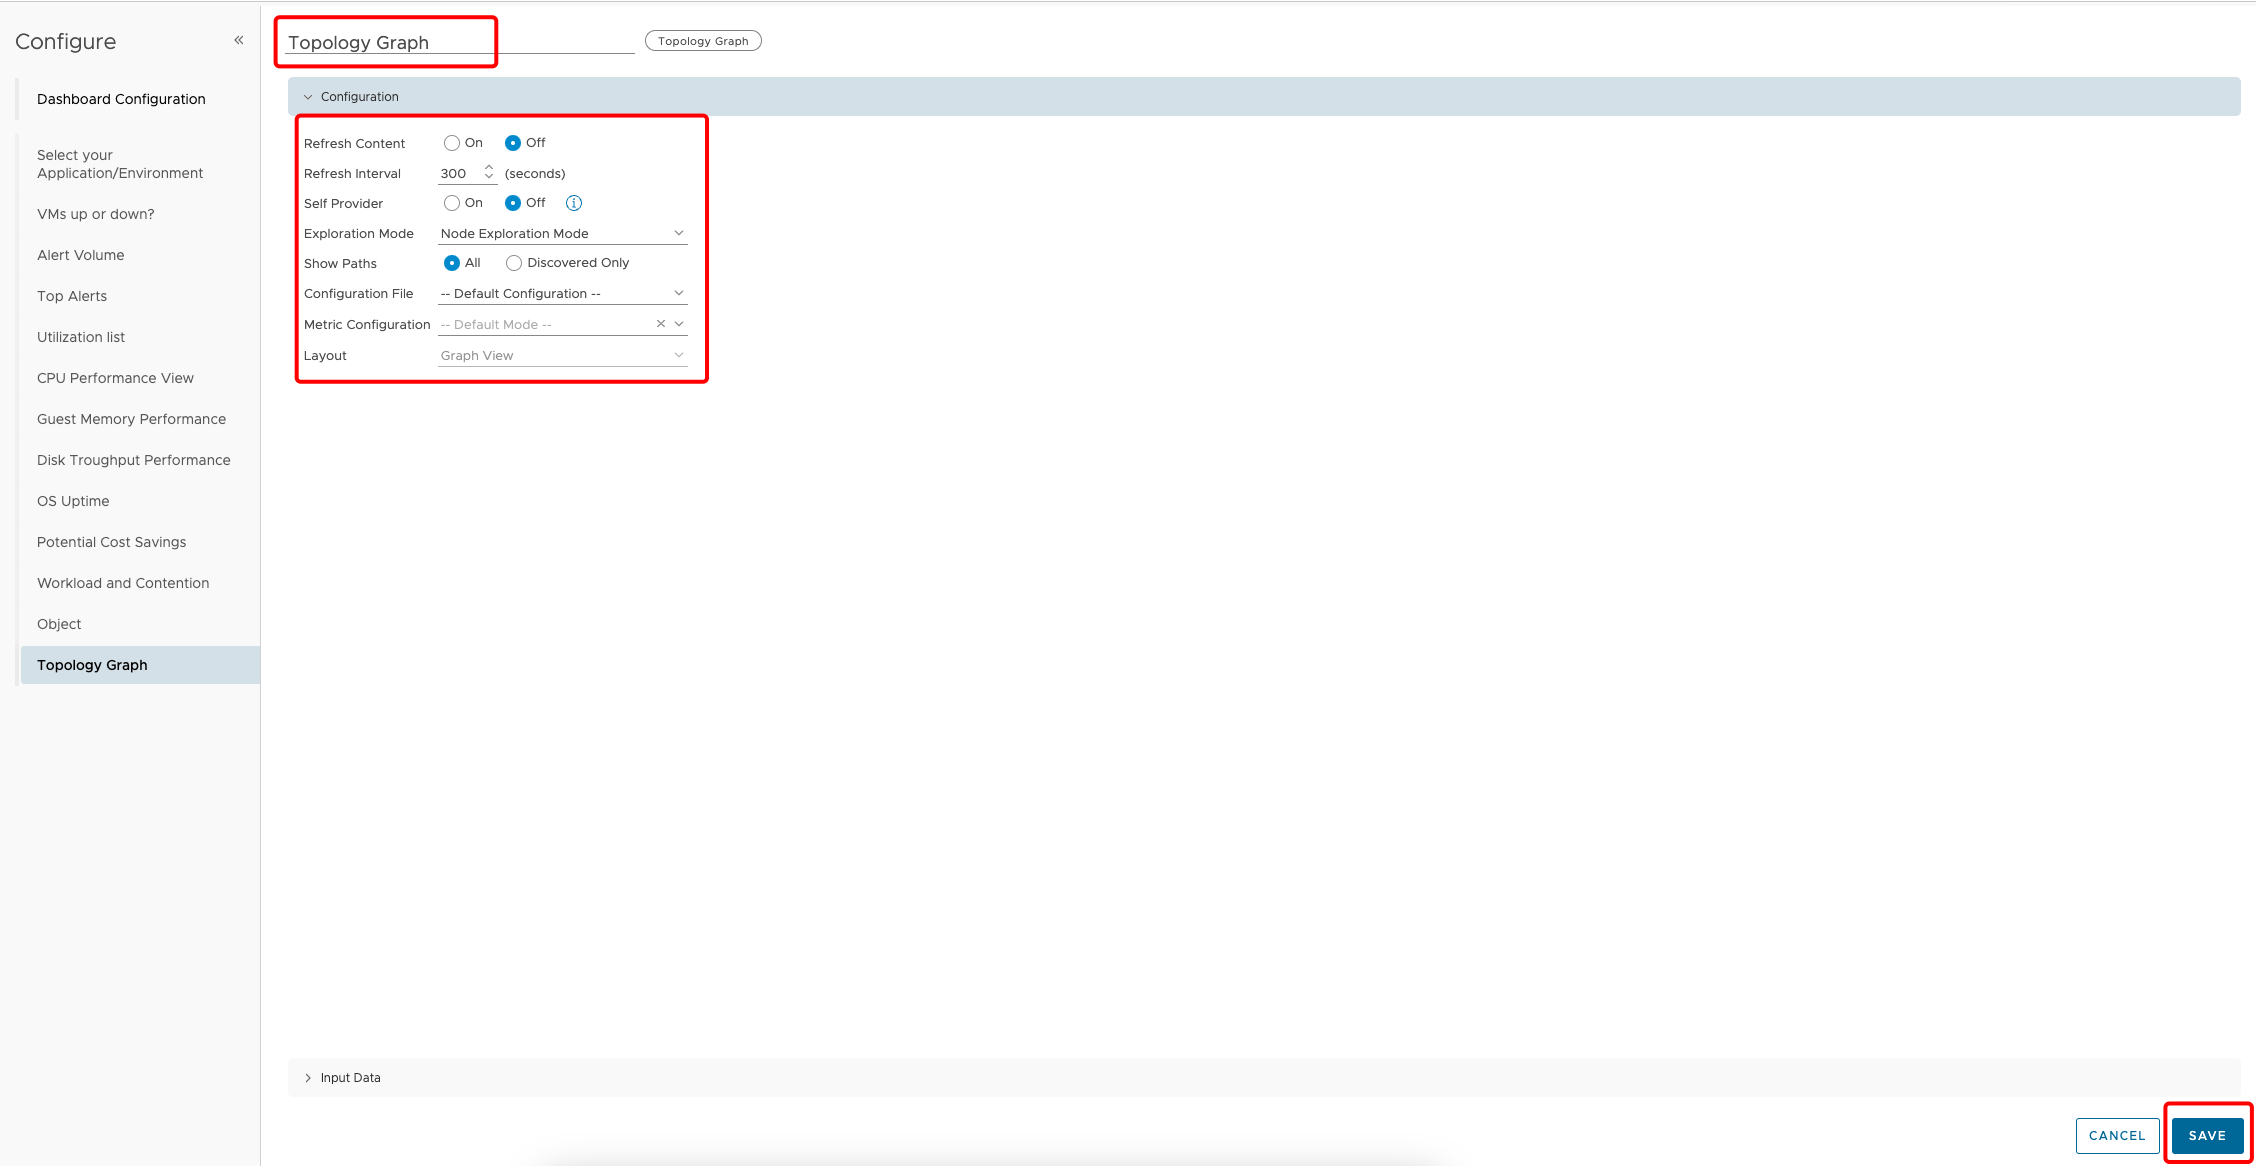
Leave the default values and click on SAVE.
Workload Pattern
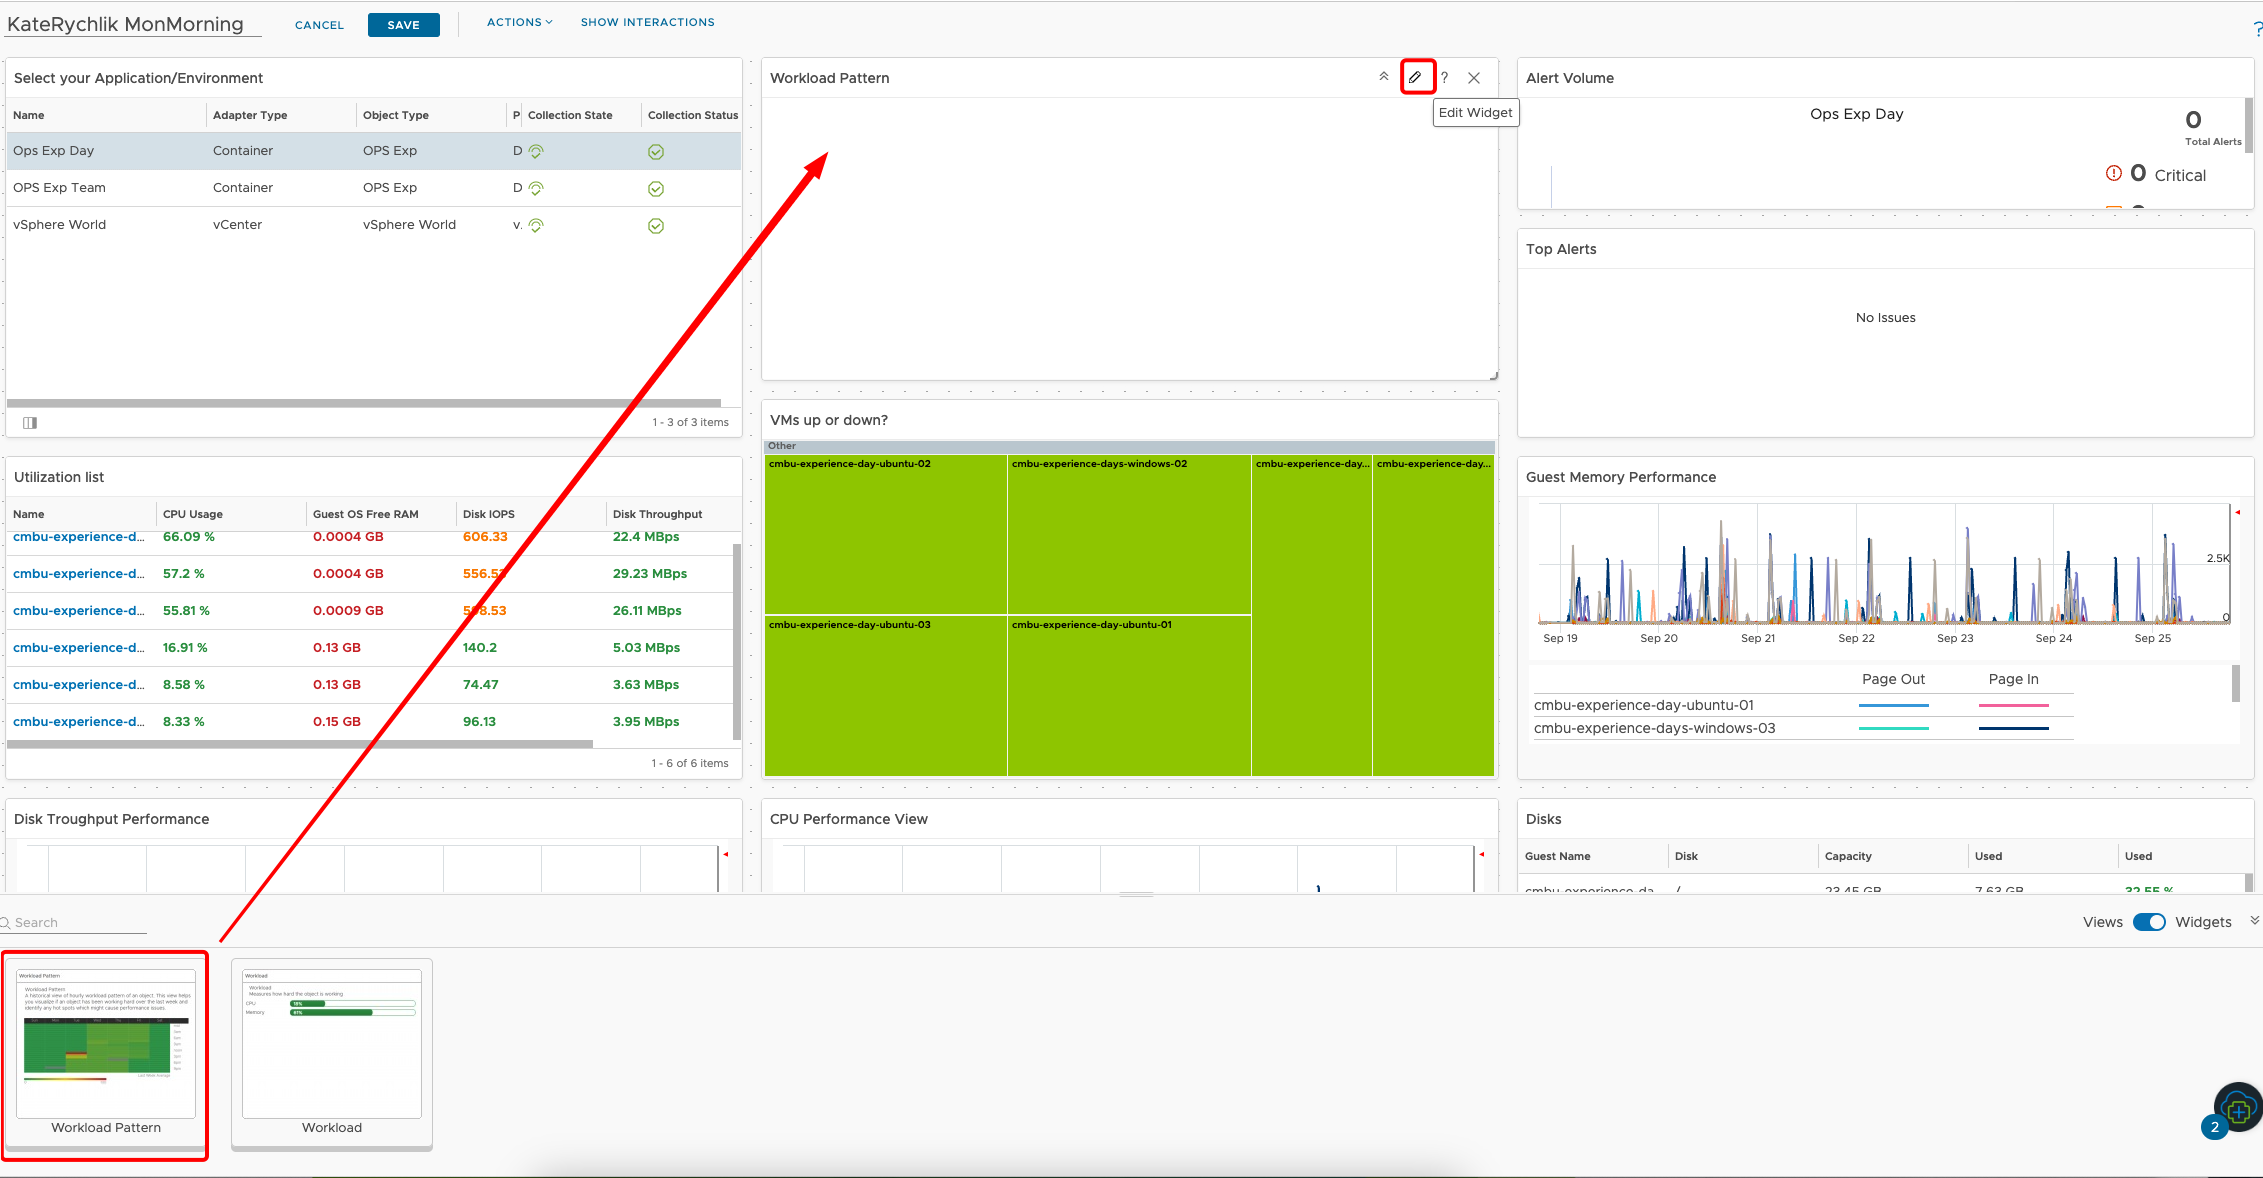
- Find Workload Pattern widget.
- Drop Workload Pattern widget on canvas.
- Click Pencil icon to edit widget.
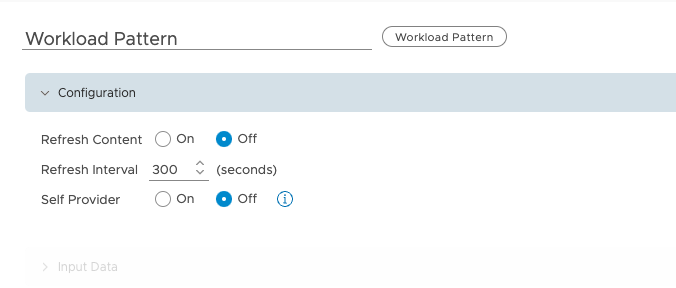
Leave default values and click on SAVE.
Interactions
Widget interactions are the configured relationships between widgets in a dashboard where one widget provides information to a receiving widget. When you are using a widget in the dashboard, you select data on one widget to limit the data that appears in another widget, allowing you to focus on a smaller subset data.
How interactions work
If you configured interactions between widget at the dashboard level, you can then select one or more objects in the providing widget to filter the data that appears in the receiving widget, allowing you to focus on data related to an object.
To use the interaction option between the widgets in a dashboard, you configure interactions at the dashboard level. If you do not configure any interactions, the data that appears in the widgets is based on how the widget is configured.
When you configure widget interaction, you specify the providing widget for the receiving widget. For some widgets, you can define two providing widgets, each of which can be used to filter data in the receiving widget.
As a part of our lab, we need to configure interactions to see data filtered by previously created group.
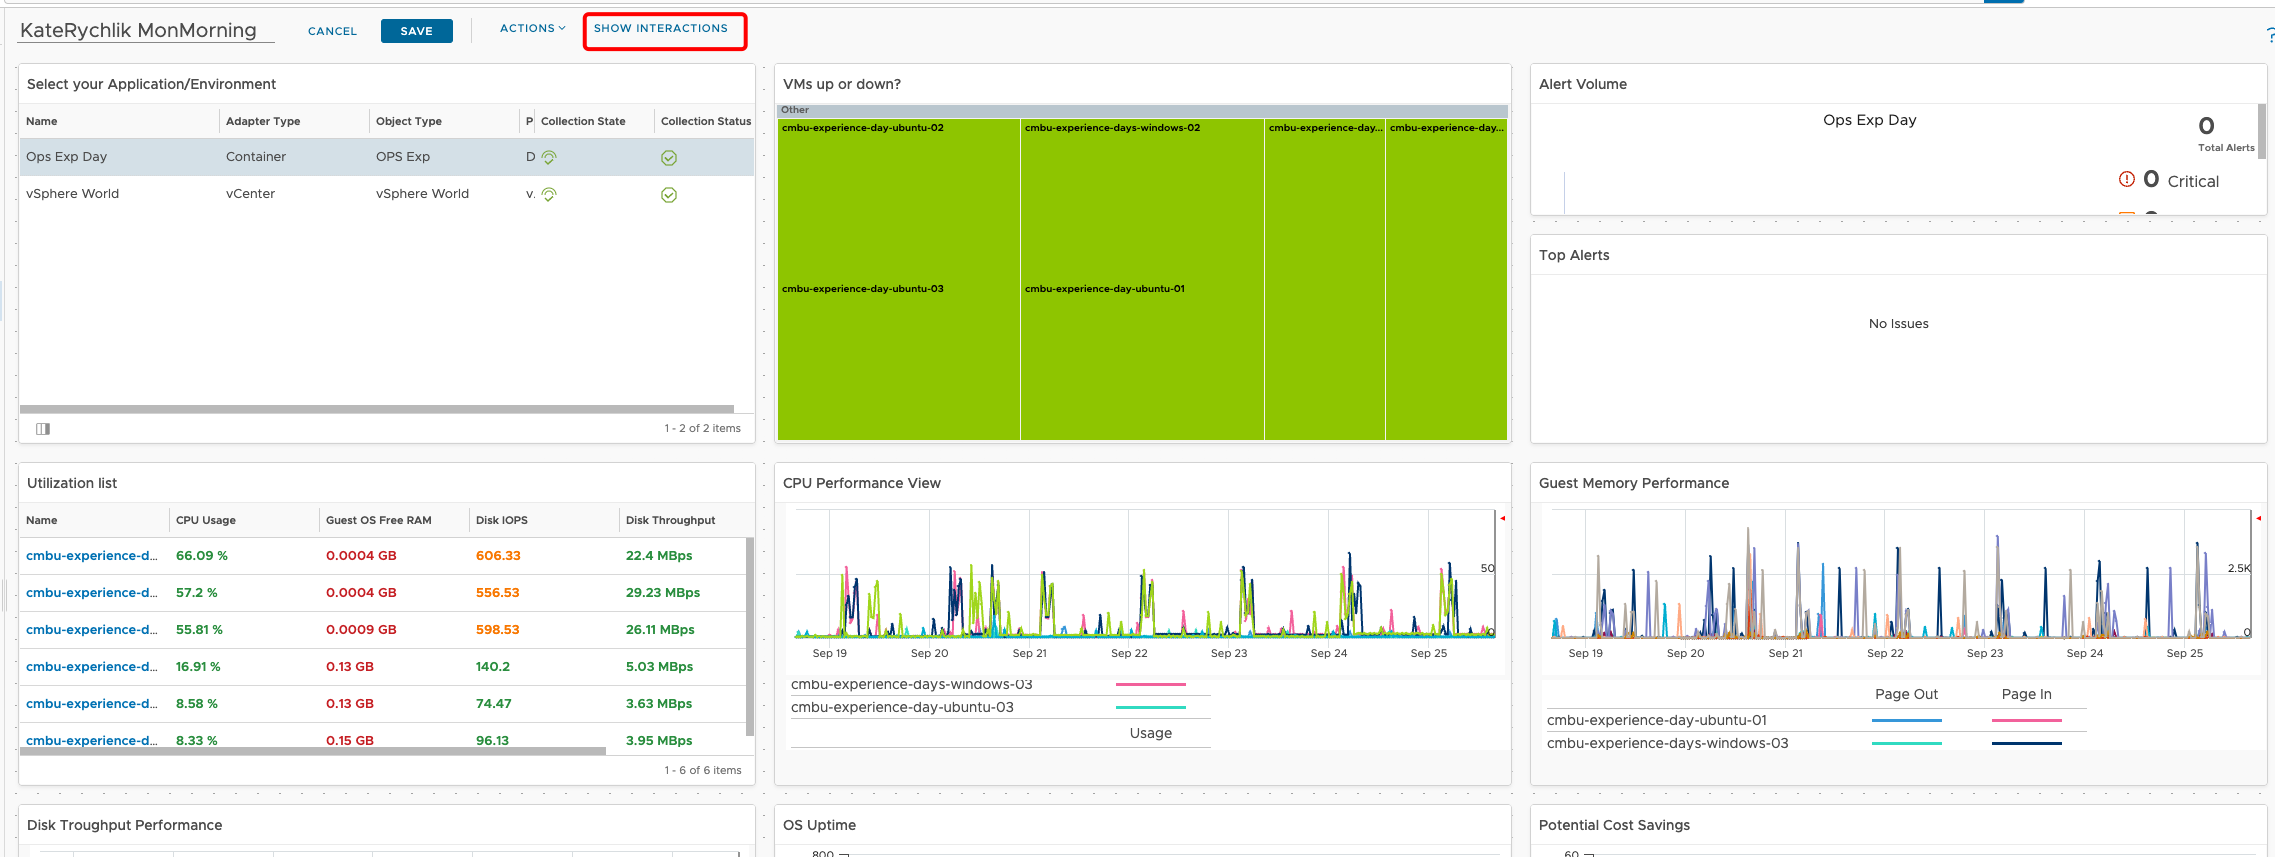
Click on SHOW INTERACTIONS on top dashboard menu.
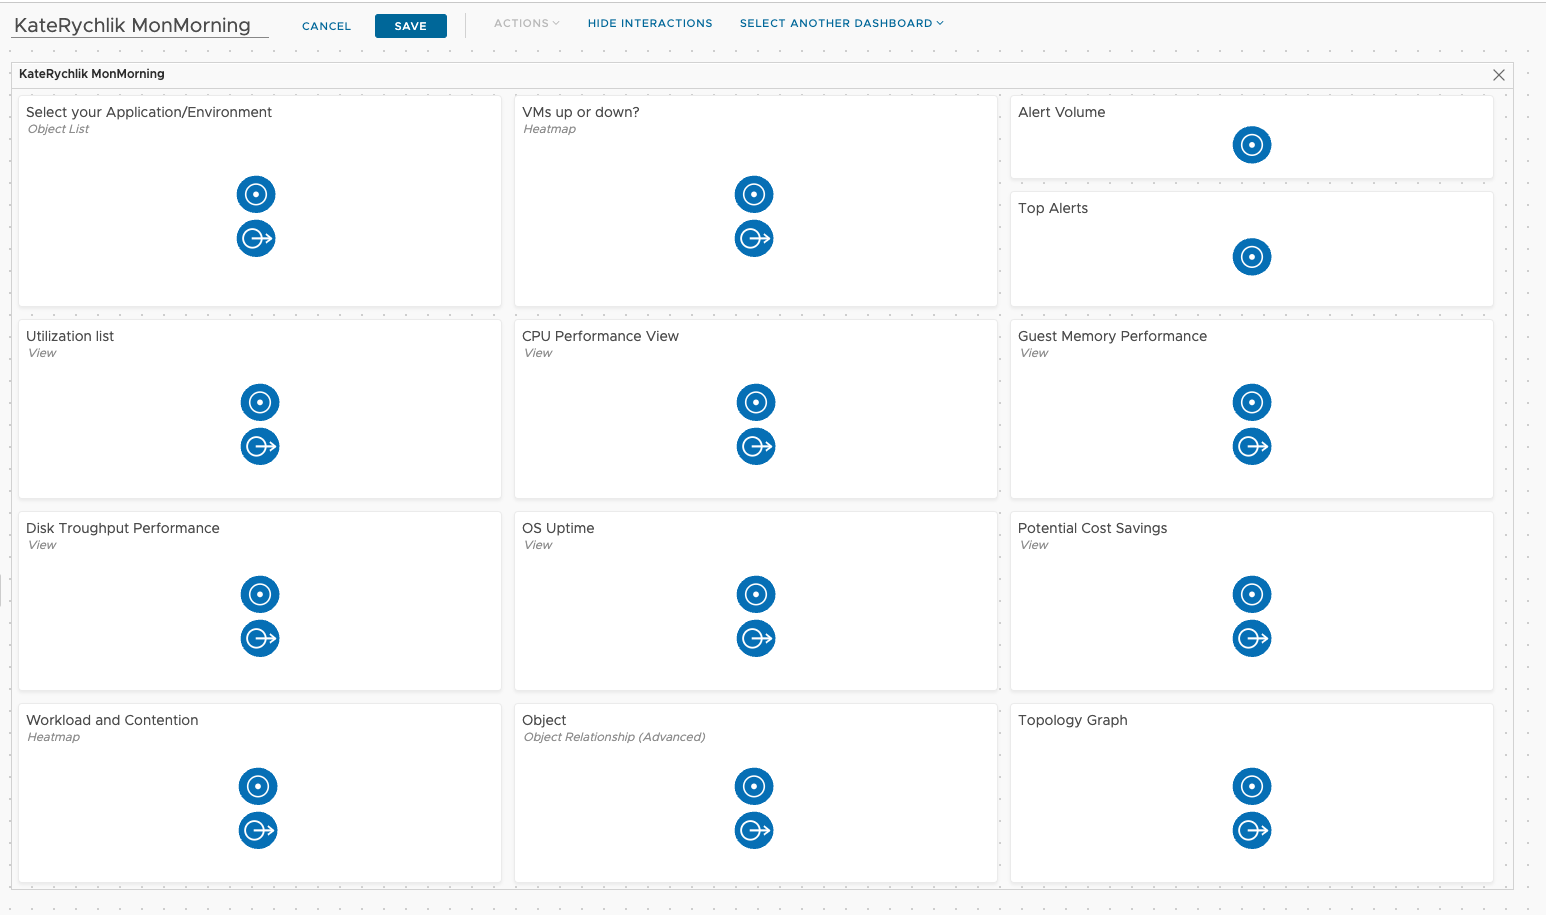
Before you start the interactions show all added widgets and have no connections.
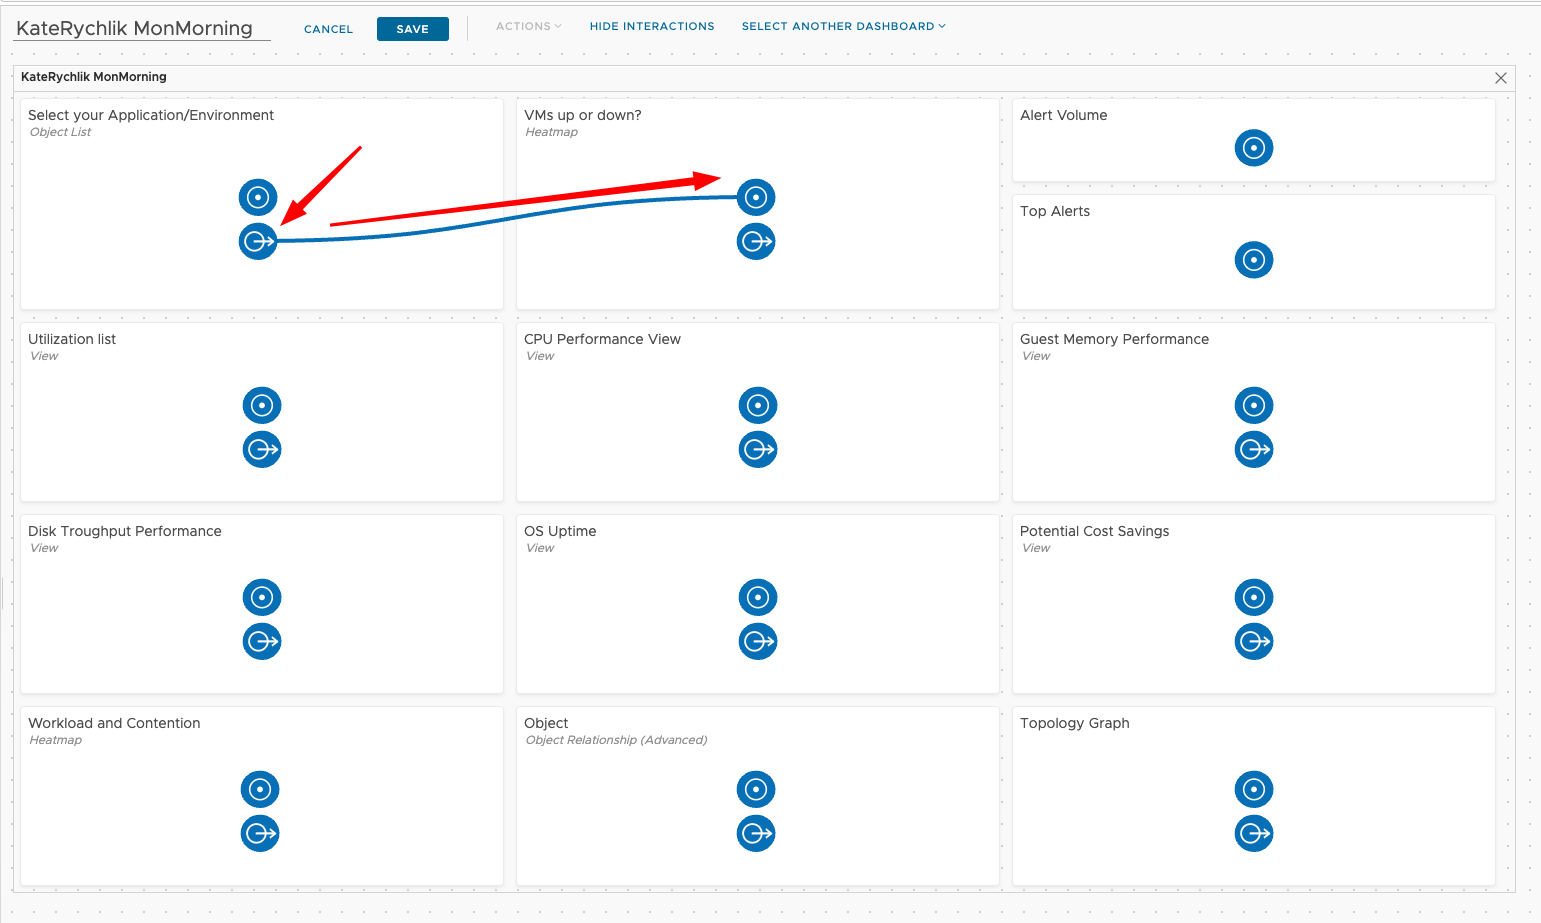
To create interaction click on Outgoing Object Interaction dot for “Select your Application/Environment” widget and drag it to Incoming Object Interaction on All Widgets as per screenshot.
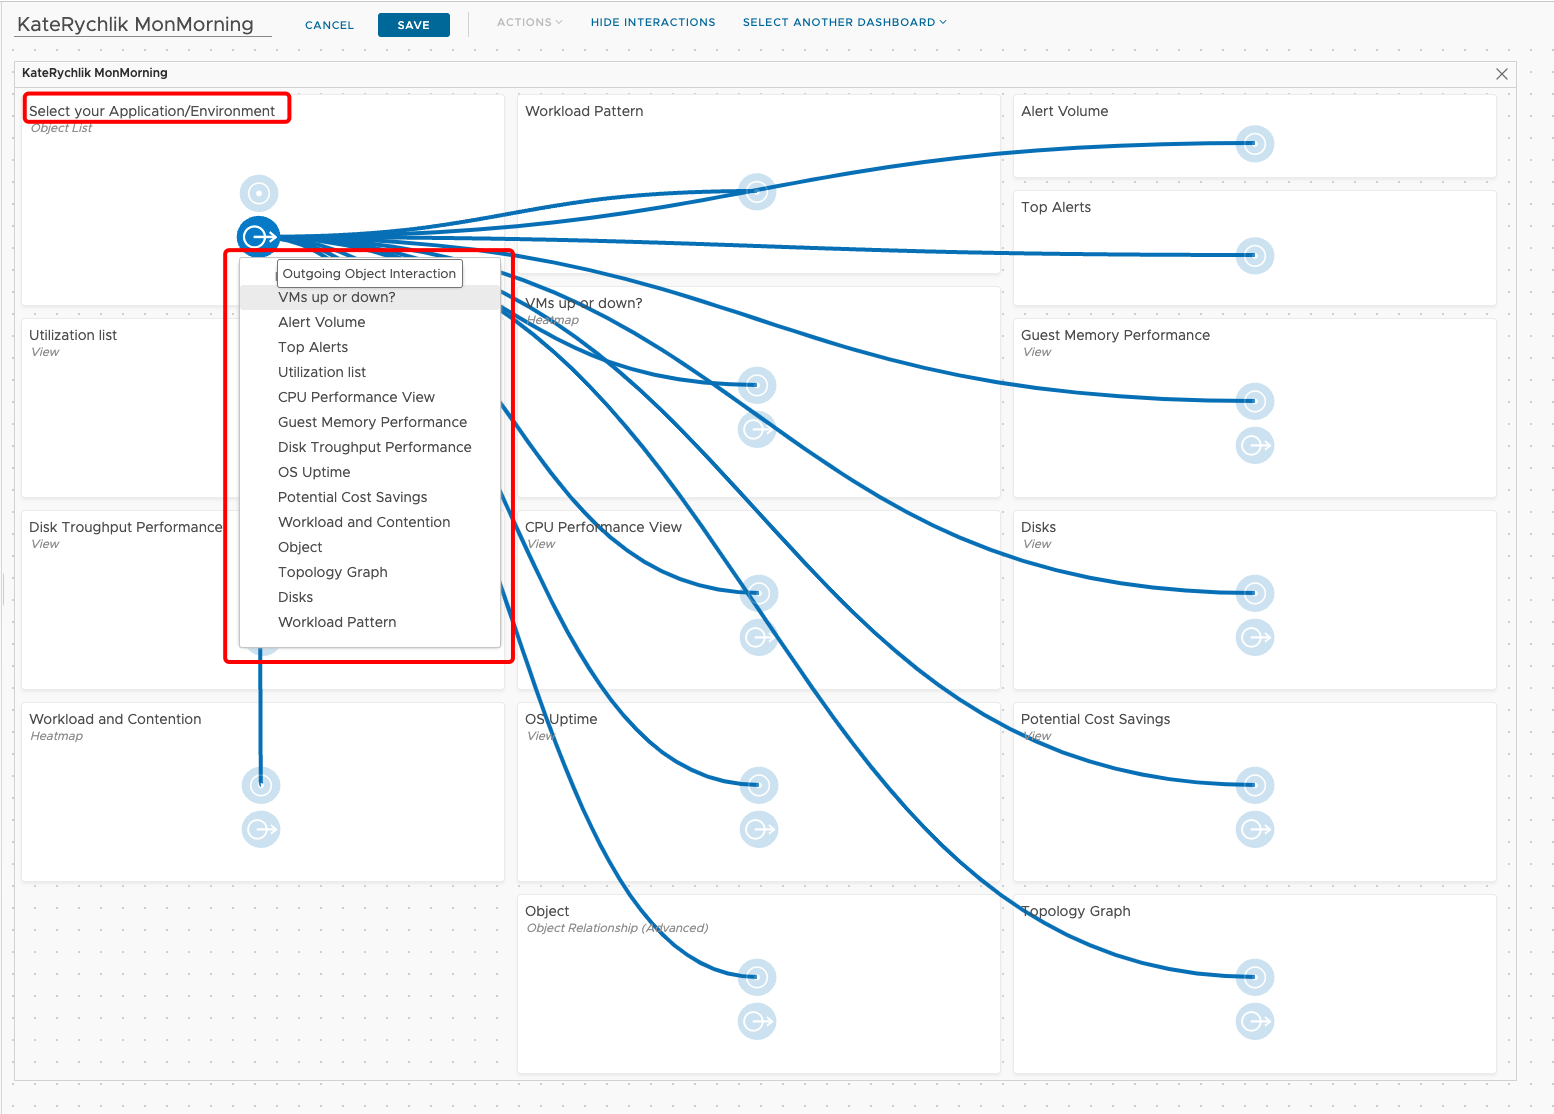
Repeat the step above and create interactions for all widgets in the screen. Make sure that all of them have connection created.
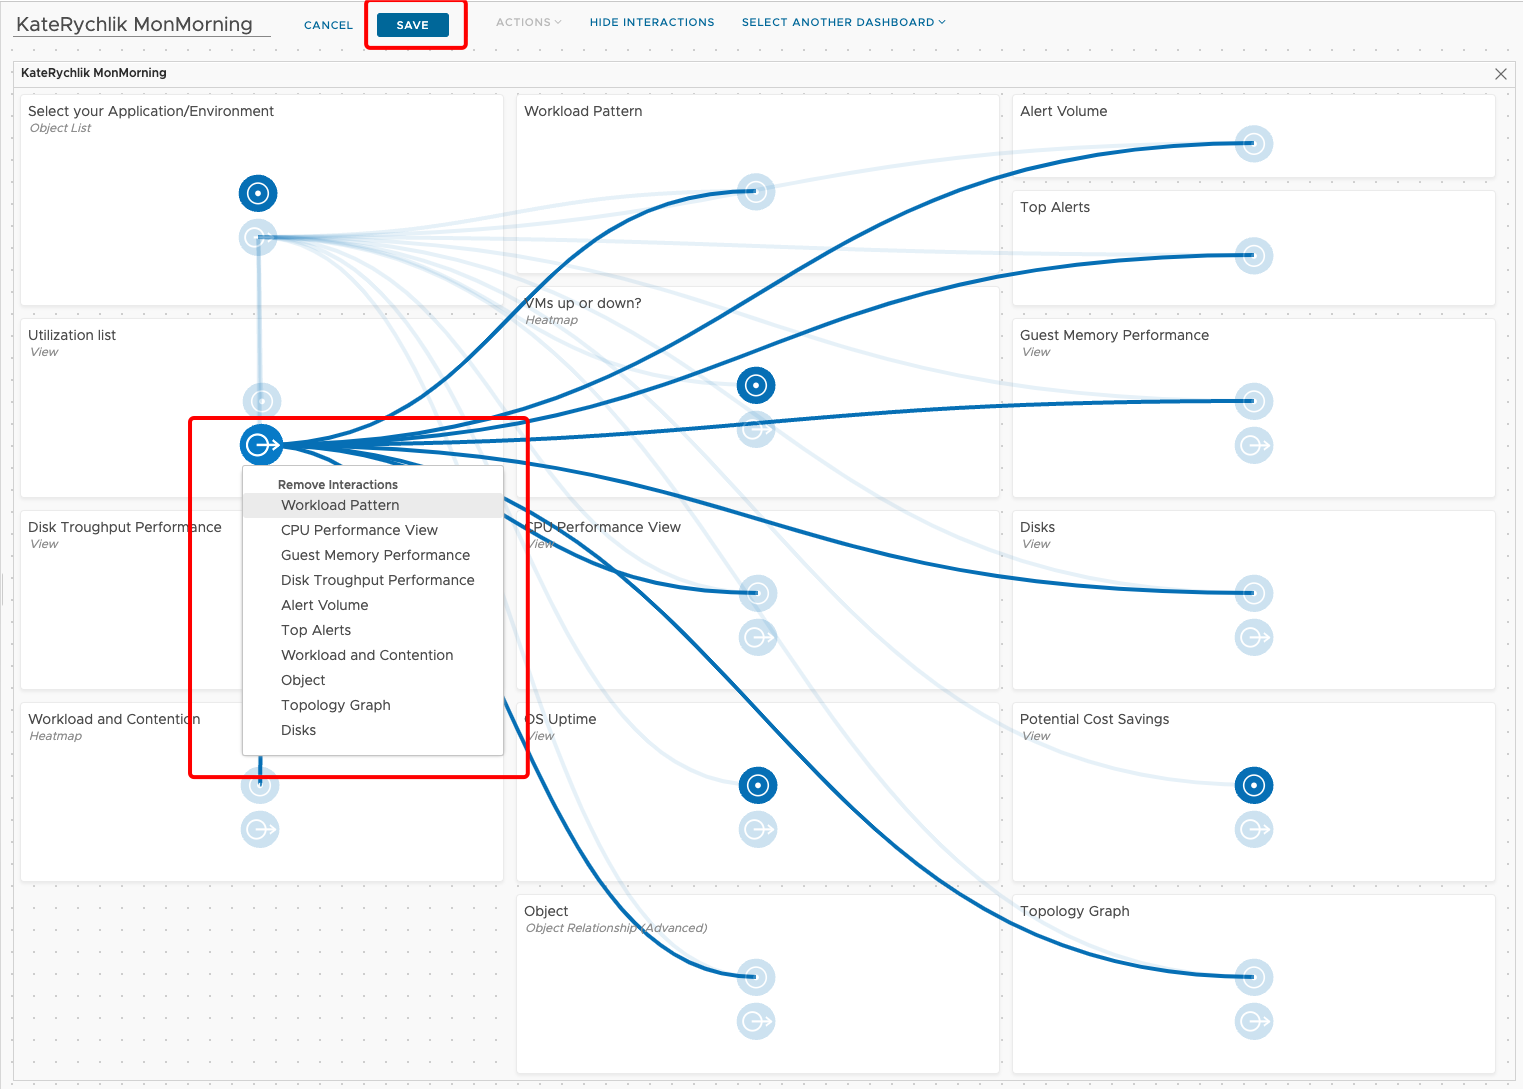
- To create interaction click on Outgoing Object Interaction dot for “Utilization listt” widget and drag it to Incoming Object Interaction on listed Widgets as per screenshot.
- Click on SAVE.
Dashboard cleanup
To make the dashoard to display data as per desired view you need to edit and resize the widgets to form planned outcome.
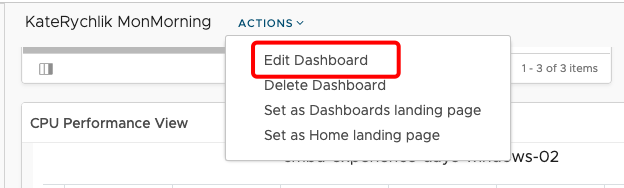
Click on Edit Dashboard and next play around to try to create view below.
As a last task play around w